

The Consumer Price Index for All Urban Consumers (CPI-U) rose 0.4% in September on a seasonally adjusted basis after rising 0.1% in August, the U.S. Bureau of Labor Statistics reported today. Over the last 12 months, all items index increased 8.2% before seasonal adjustment.
Rising U.S. interest rates, following hotter-than-expected inflation in September, are also expected to weigh on economic activity, which could dent crude demand. Strength in the dollar also makes crude more expensive for importers.
U.S. Dollar Index (USDX)
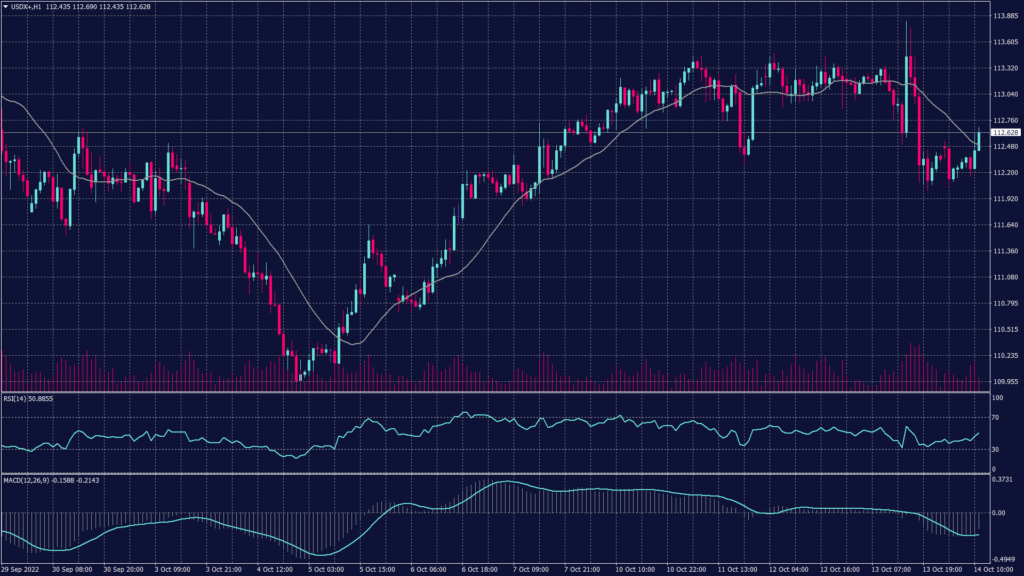
The dollar slightly retreated during the early trades as risk appetite returned to global stock markets. Meanwhile, investors appeared to shift their focus away from U.S. interest rate considerations.
The dollar index shed 0.3%, extending the overnight session’s 0.5% decline as investors seemingly brushed off data that showed U.S. consumer prices increased more than expected in September.
Technically:
The index fell from the resistance levels at 113.25 towards the key support at 112.40 which is expected to grant momentum for a rebound.
However, we still expect two scenarios at this stage. The first one, if the index broke above 113.25 it will probably head towards 114 and 114.30. on the other hand, if the index failed to penetrate the resistance, it might head towards 112 in the short run. However, the daily chart remains positive as long as the index is trading above 109.60.
Pivot Point: 112.60
| SUPPORT | RESISTANCE |
| 112.40 | 112.80 |
| 112.10 | 113.25 |
| 111.90 | 113.40 |
Sterling Pound (GBPUSD)
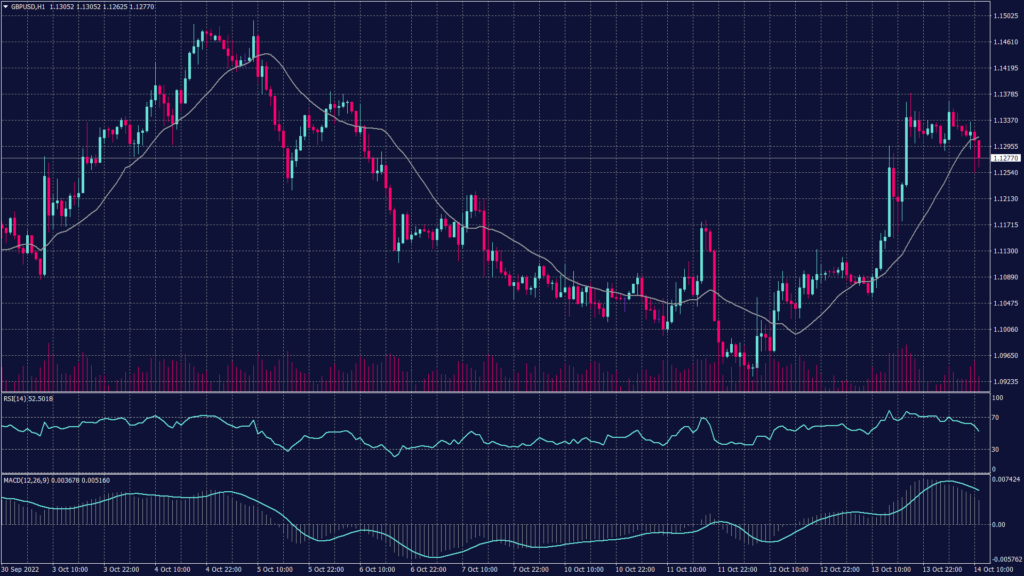
Sterling made steep gains overnight against the dollar as a result of the inflation report. It was last traded at $1.1311 during the early Asia session, down 0.15%.
British finance minister Kwasi Kwarteng cut short his trip to Washington amid reports that Prime Minister Liz Truss was considering reversing elements of the plan announced three weeks ago that triggered turmoil in financial markets.
The Bank of England has had to step in to restore calm, announcing an emergency bond buying program but is also adamant it will end the program on Friday.
Pivot Point: 1.1265
| SUPPORT | RESISTANCE |
| 1.1200 | 1.1315 |
| 1.1155 | 1.1360 |
| 1.1120 | 1.1380 |
Spot Gold (XAUUSD)
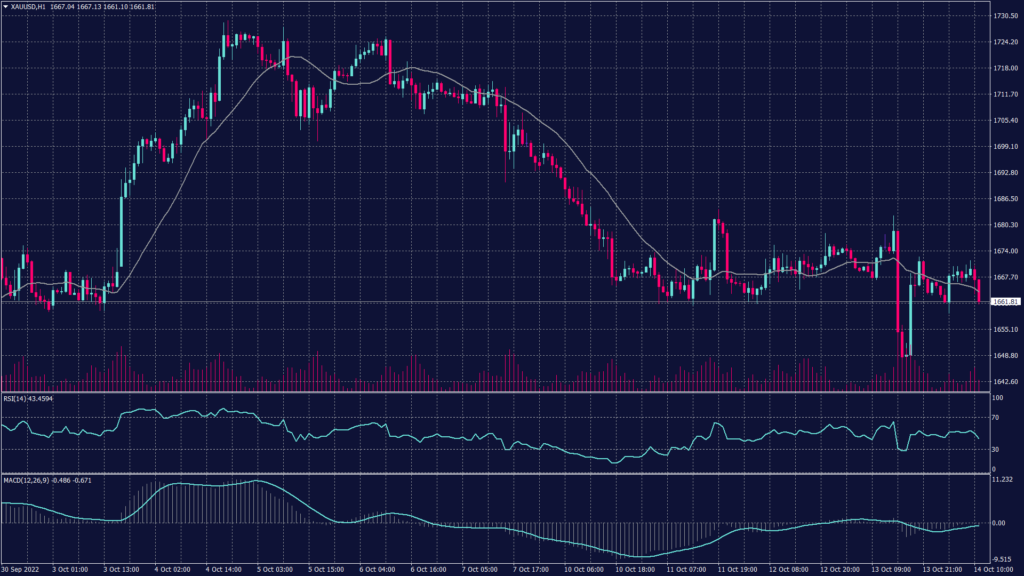
Gold prices fell on Friday and were set to close the week lower amid fears of more interest rate hikes by the Federal Reserve. Bullion prices dropped well below $1,650 on Thursday after U.S. CPI inflation data read higher than expected for September. But they then rebounded sharply, tracking a broader risk-on rally that weakened the dollar.
Spot gold fell 0.3% to $1,661.98 an ounce, while gold futures fell 0.5% to $1,668.20 an ounce. This week, but both benchmarks are set to lose 1.8% and 2.3%, respectively.
The outlook for gold was also clouded by hotter-than-expected U.S. inflation data, which gives the Fed more impetus to keep hiking interest rates sharply. The yellow metal is likely set for more pressure from a stronger dollar in the coming months, as U.S. interest rates keep trending higher.
Technically:
Gold prices are heading downwards on the hourly chart reaching the support at $1,665 per ounce. However, the current support is not strong enough to hold against the current selling pressure which might break the supports at 1,665 and 1,659 to head towards 1,650.
Meanwhile, the daily chart remains within the downtrend channel heading towards 1,620 on the foreseen time frame.
Pivot Point: 1,665
| SUPPORT | RESISTANCE |
| 1,659 | 1,675 |
| 1,650 | 1,680 |
| 1,640 | 1,690 |
West Texas Crude (USOUSD)
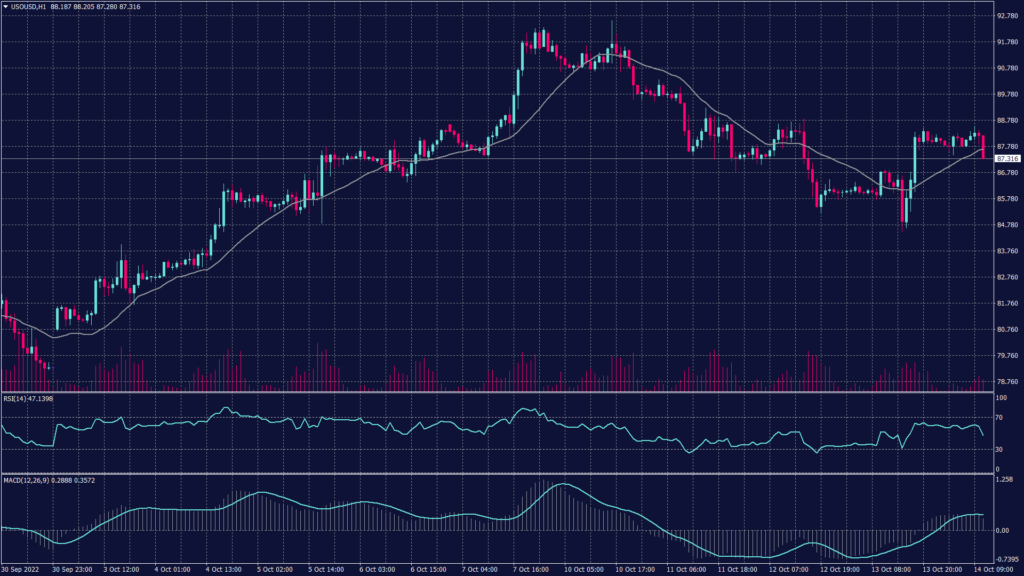
Oil prices reversed earlier losses and inched up in Asian trade on Friday, supported by a weaker U.S. dollar and as diesel inventories fell. Meanwhile, Brent crude futures rose 0.3% to $94.86 per barrel, while WTI crude futures were up 0.35% at $89.42 per barrel.
Technically:
The WTI chart shows a downward trend on the daily chart while trading right above the support at 86.60. However, the technical indicators show a chance of fluctuations between 85.60 and 87.40 before deciding the actual trend.
The hourly chart on the other hand is moving below the 20 and 50 periods moving average which indicates a high possibility of a negative trend continuation.
Pivot Point: 87.60
| SUPPORT | RESISTANCE |
| 86.30 | 89.30 |
| 84.85 | 90.80 |
| 83.40 | 92.25 |
