

U.S. Dollar Index (USDX)
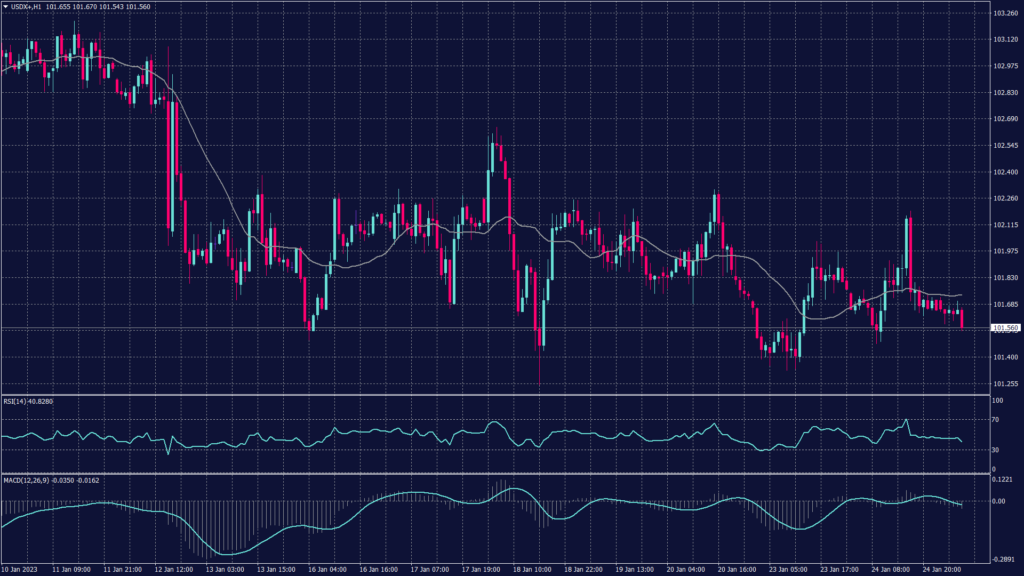
The U.S. dollar weakened 0.1% this morning ahead of the PCE data due on Thursday. Markets expect the PCE to decline thus inflation to further slowdown. PCE report is known to be the measure for Feds policy, further decline means less tightening and rate hikes.
Focus this week is on U.S. fourth-quarter GDP data to gauge how much growth slowed towards the end of 2022, especially as the effects of sharp interest rate hikes and relatively higher inflation began to be felt.
The dollar index trades under heavy selling pressure and remains committed to the downtrend that started in early November. Meanwhile, technical indicators show a possibility of a further decline toward 101.40.
Pivot Point: 101.60
| SUPPORT | RESISTANCE |
| 101.40 | 101.80 |
| 101.25 | 102.10 |
| 101.00 | 102.40 |
Australian Dollar (AUDUSD)
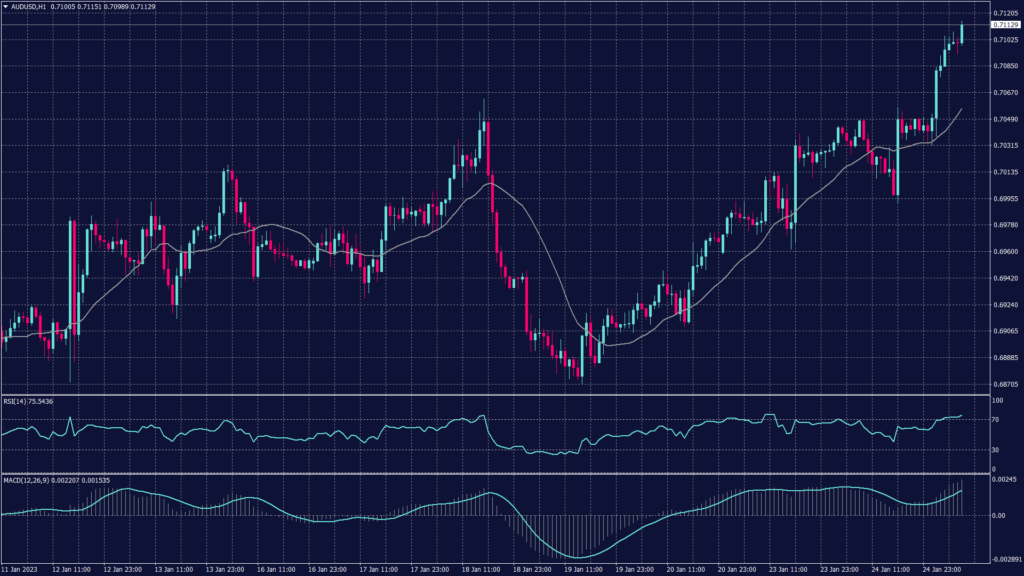
The Australian dollar gained 0.3% to $0.7066 after the Australian CPI data which showed a growth of 1.9% quarterly. The reading was higher than expectations of 1.6%, as well as the prior quarter’s reading of 1.8%.
The reading now puts more pressure on the Reserve Bank of Australia (RBA) to keep raising interest rates, given that inflation has remained hot even after the central bank hiked rates by a cumulative 300 basis points (bps) in 2022, from a record low of 0.1%.
The Aussie pair shows a solid momentum rising above 0.7050 reaching the resistance of 0.7120 on the hourly chart. Technical indicators show the pair as overbought but the price action suggests otherwise. Meanwhile, the daily chart shows a continuation of the uptrend and targeting the resistance level of 0.7150, which is the previous top on the chart.
Pivot Point: 0.7115
| SUPPORT | RESISTANCE |
| 0.7090 | 0.7150 |
| 0.7050 | 0.7250 |
| 0.7020 | 0.7270 |
Spot Gold (XAUUSD)
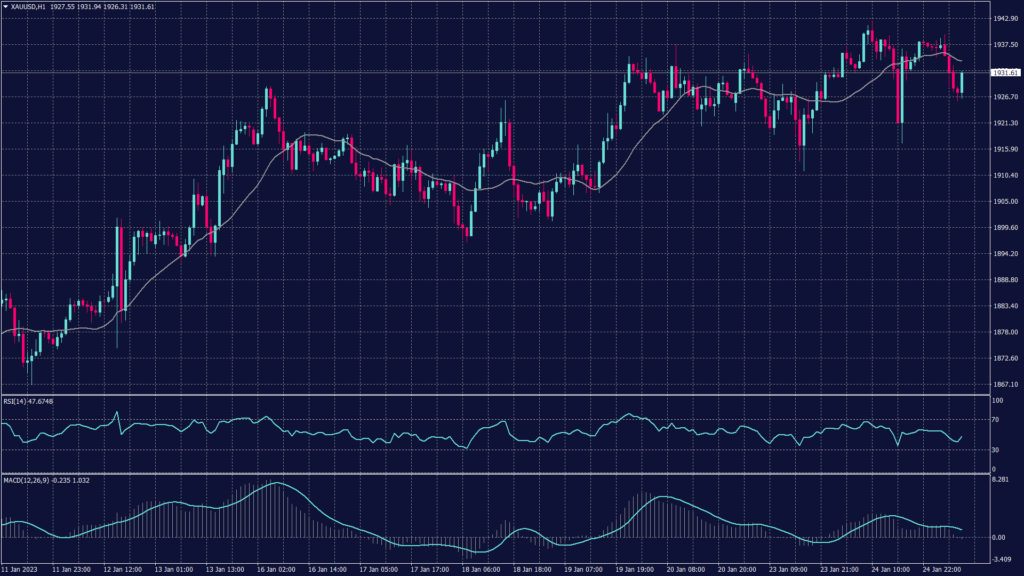
Gold prices remained solid near a nine-month high during the morning sessions, while fears of a looming recession kept safe haven demand elevated.
Spot gold was flat at $1,937.64 an ounce, while gold futures rose 0.2% to $1,938.35 an ounce. The yellow metal’s spot price narrowed the gap with the futures contract, ahead of the latter’s expiry in February.
Gold remains inside the horizonal range between 1,920 and 1,940 on the daily chart which indicates neutral trend pressure. However, the hourly chart shows higher probability of fluctuations between 1,930 and 1,935. The intraday fluctuations will open a chance for speculative gains.
Pivot Point: 1,930
| SUPPORT | RESISTANCE |
| 1,927 | 1,935 |
| 1,921 | 1,940 |
| 1,921 | 1,950 |
WTI Futures (CL-OIL)
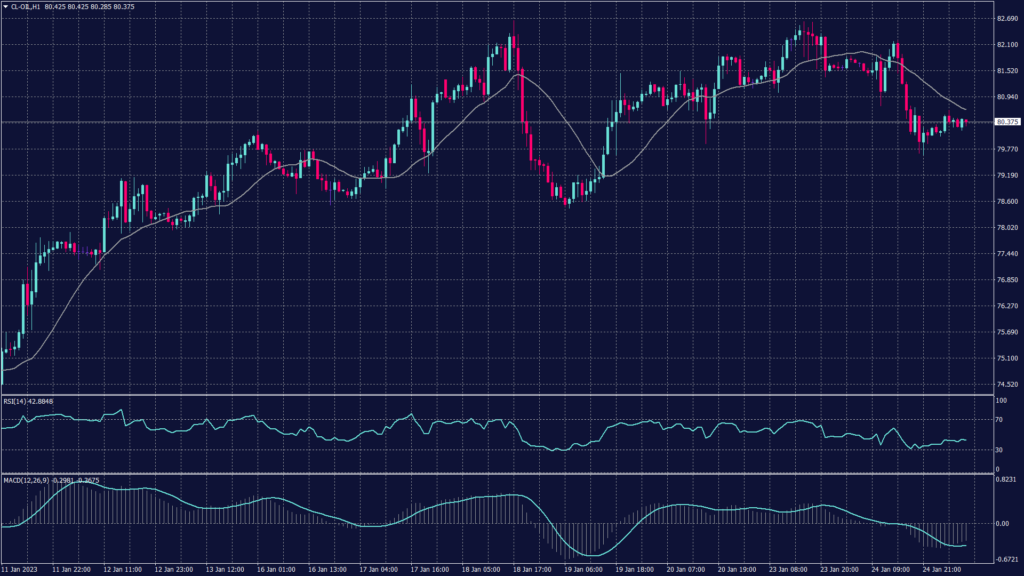
Crude oil prices rebounded on Wednesday as demand recovery hopes in top importer China following its exit from COVID-19 pandemic curbs provided support after prices dropped in the previous session on concerns about global economic growth.
Brent crude futures gained 0.7% to $86.72 per barrel after falling 2.3% in the previous session. Meanwhile, the WTI rose 0.6% to $80.59 per barrel after it shed 1.8% on Tuesday. On the supply side, oil supply should remain steady for the medium term as OPEC+ is expected to keep its output quotas.
Technically, crude oil is trading under bearish pressure that is accumulating above $80 mark. The chart is expected to show further decline as the hourly chart shows slowing buying pressure. The technical indicators show divergence and a tendency for further decline.
Pivot Point: 80.10
| SUPPORT | RESISTANCE |
| 79.65 | 81.70 |
| 79.10 | 82.60 |
| 78.45 | 83.50 |
