

market news summary
US stocks closed higher yesterday on Thursday, regaining some momentum thanks to a recovery in the technology sector and a decrease in volatility to record levels ahead of a busy week of economic and monetary policy events. Investors are eagerly awaiting inflation data and the Federal Reserve’s policy meeting next week.
European stocks recorded a lukewarm performance on Thursday, with declines in technology and interest rate-sensitive consumer goods stocks amid expectations that major central banks will raise interest rates again. The STOXX 600 index of European stocks closed largely unchanged with a marginal decline of 0.3% in the technology sector.
Dollar Index (USDX)
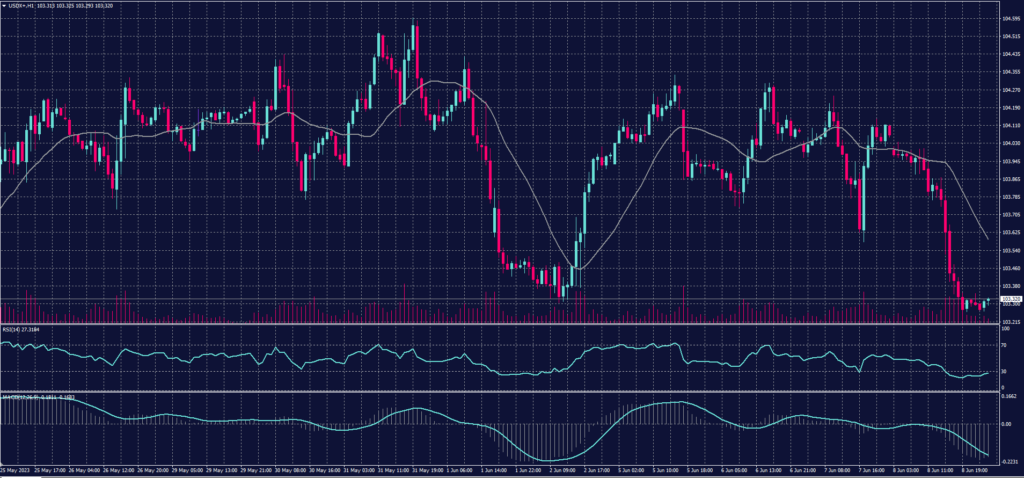
The dollar recovered from its losses yesterday on Thursday, following the release of US unemployment claims data that supported the Federal Reserve’s cautious stance on monetary policy after jobless claims rose more than expected. The dollar index recorded a decline of 0.5% to 103.550 points.
Pivot point: 103.50
| Resistance level | Support level |
| 103.75 | 103.00 |
| 104.30 | 102.70 |
| 104.55 | 102.25 |
Spot Gold (XAUUSD)
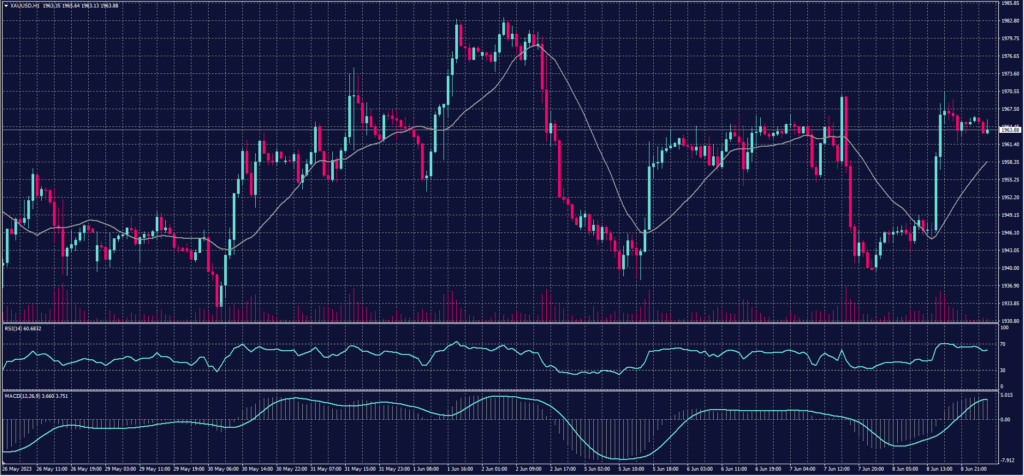
Gold prices rose Thursday, June 8, supported by the weakness of the dollar, but the yellow metal hovered near the low levels it recorded in the previous session, as investors await indications from the US Federal Reserve after the Bank of Canada raised interest rates to the highest level in 22 years.
And gold rose in instant transactions, 1965 dollars an ounce, after falling 1% in the previous session. And US gold futures rose 1970.00 dollars.
Pivot point: 1958
| Resistance level | Support level |
| 1977 | 1946 |
| 1989 | 1927 |
| 2000 | 1914 |
Dow Jones Index (DJ30ft – US30)
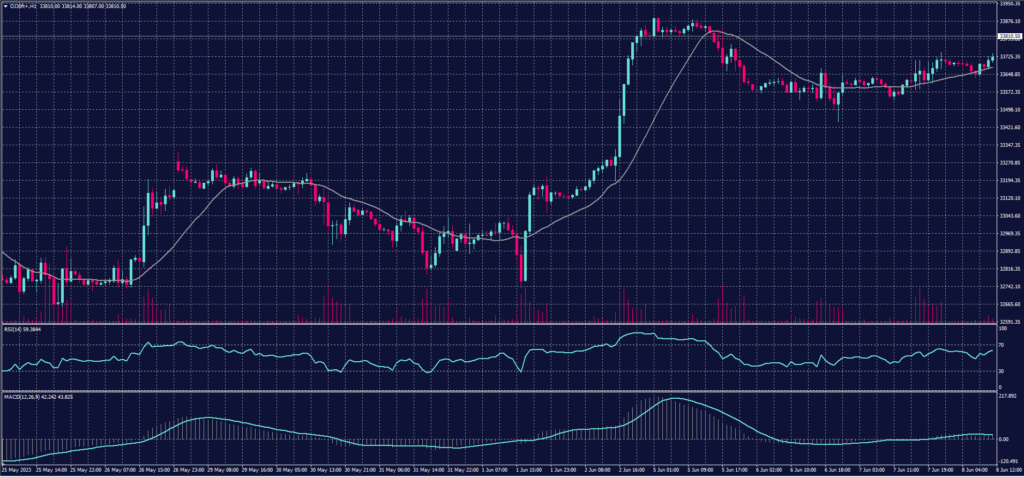
The US indices closed with collective gains in yesterday’s Thursday session, supported by a recovery in technology stocks amidst low liquidity ahead of a busy week of events.
The US Department of Labor is scheduled to release inflation data on June 13, the first day of the Federal Reserve meeting. The numbers are expected to show a slight decrease in consumer prices in May.
The Dow Jones index rose by approximately 0.5%, equivalent to about 168 points, on Thursday, marking its highest close in 5 weeks.
Pivot point: 33.795
| Resistance level | Support level |
| 33955 | 33680 |
| 34065 | 33520 |
| 34225 | 33410 |
US Crude (USOUSD)
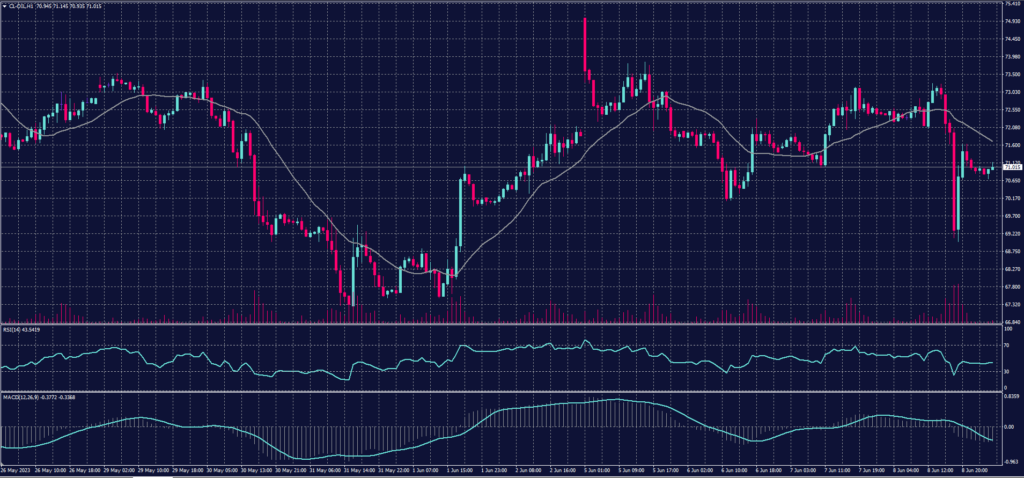
Oil prices declined at the close on Thursday but trimmed their losses after the United States and Iran denied a media report suggesting they were nearing a nuclear agreement.
Brent crude fell by 99 cents or 1.3% to $75.96 per barrel at the settlement, while West Texas Intermediate (WTI) crude dropped by $1.24 or 1.7% to $71.29 per barrel.
Pivot point: 71.05
| Resistance level | Support level |
| 73.10 | 68.85 |
| 75.30 | 66.80 |
| 77.35 | 64.65 |
Risk Warning
This material provides real-time market analysis from contributing analysts. Please note that any views expressed in this material do not constitute operational advice. It is important to assess your risk tolerance and make independent trading decisions. STARTRADER holds no responsibility for any trading consequences that may arise from relying on the views expressed in this material.
