

U.S. Dollar Index (USDX)
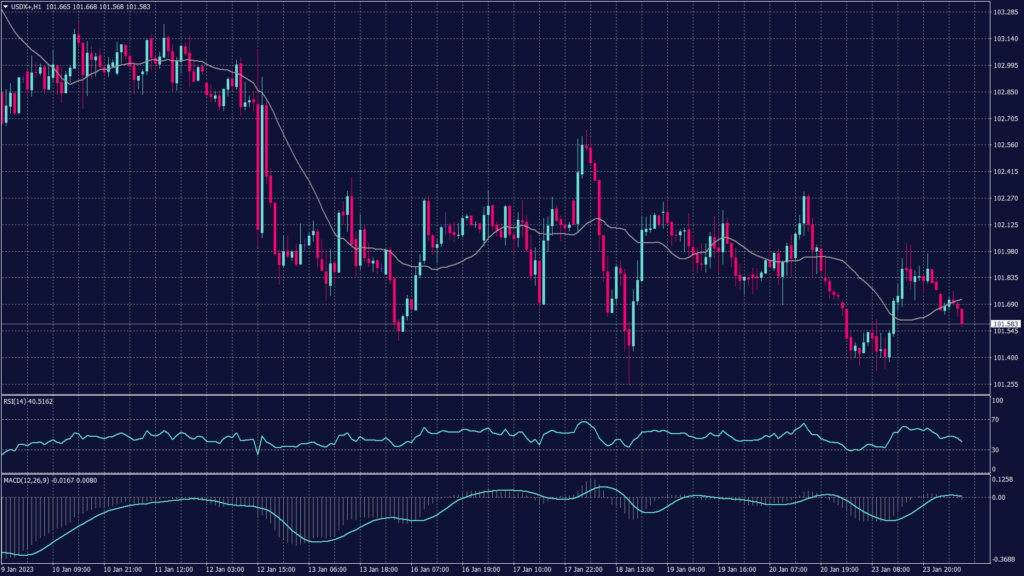
The dollar was on the weaker side this morning, hovering near an eight-month low at 101.51, as traders continued to gauge the risks of a U.S. recession and the path for Federal Reserve policy.
Traders see two more quarter-point rate hikes by the Fed to a peak of around 5% by June, with two quarter-point cuts following before year-end. Meanwhile, the Fed itself has insisted 75 basis points of more tightening is likely on the way.
The dollar index trades under heavy selling pressure and remains committed to the downtrend that started in early November. Meanwhile, technical indicators show a neutral trend and move in a horizontal fashion.
Pivot Point: 101.60
| SUPPORT | RESISTANCE |
| 101.25 | 101.80 |
| 101.00 | 102.10 |
| 100.85 | 102.40 |
Yen (USDJPY)
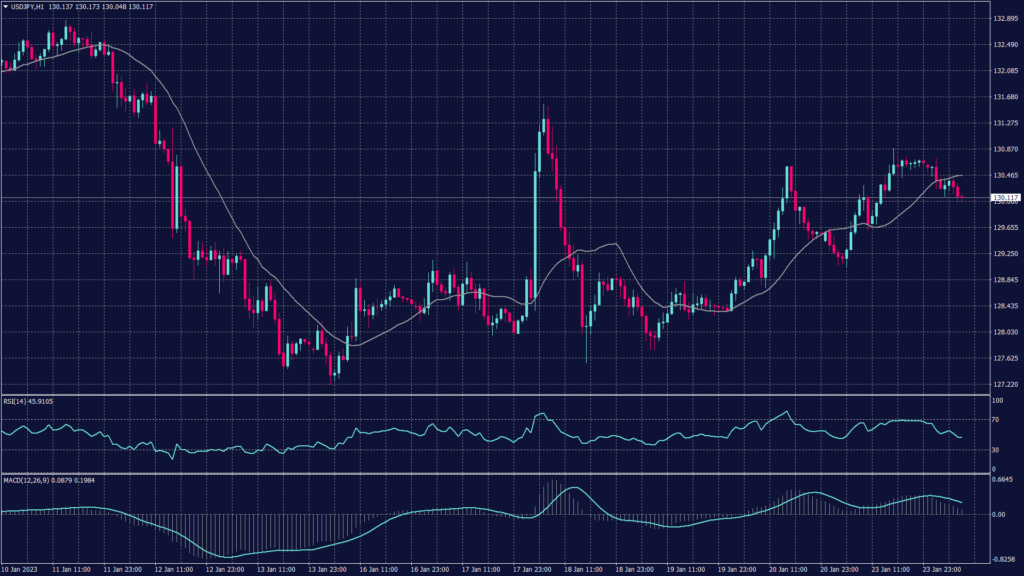
The Yen gained 0.36% to 130.19 against the greenback after two losing sessions. The pair declined to as low as 127.215 and recorded its lowest level since May. This movement was the response to the Bank of Japan’s (BOJ) policy review last week amid rising bets for an end to stimulus.
Market participants continue to expect a hawkish shift by the BOJ this year, as policymakers continue to tweak policy to extend the life of the yield curve control (YCC) mechanism, which pins short-term rates at -0.1% and keeps 10-year yields in a band around zero.
Pivot Point: 130.00
| SUPPORT | RESISTANCE |
| 129.70 | 130.20 |
| 128.70 | 130.75 |
| 128.20 | 131.20 |
Spot Gold (XAUUSD)
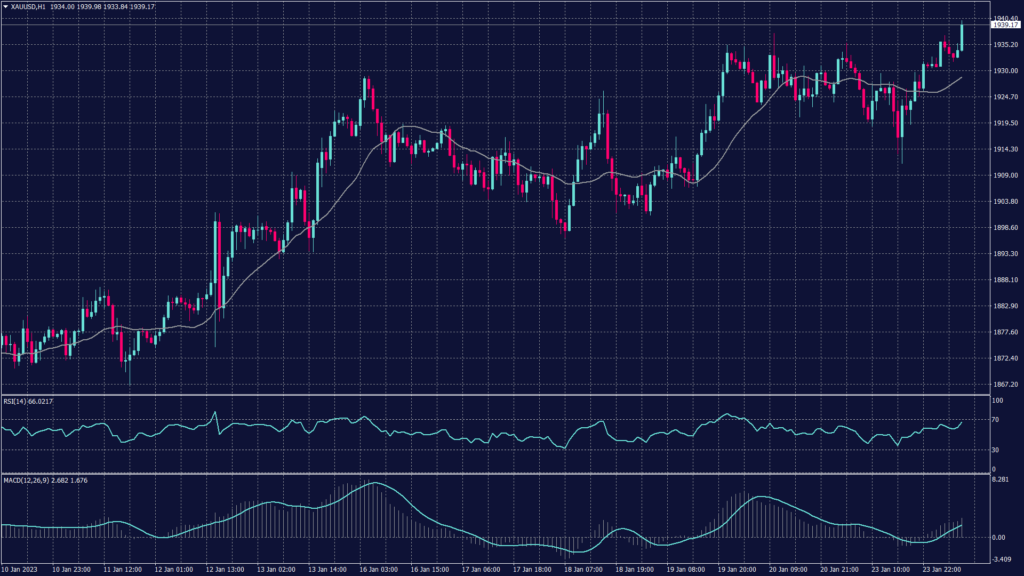
Gold prices edged up this morning as the dollar weakened, while investors awaited U.S. economic data amid hopes of slower interest rate hikes by the Federal Reserve.
Traders are mostly pricing in a 25 basis point rate hike by the Fed at its upcoming policy meeting after slowing its pace to 50 bps in December. Spot gold rose 0.2% to $1,935.69 per ounce. U.S. gold futures were up 0.4% at $1,936.00.
The daily chart shows a high possibility of breaking above 1,940. However, technical indicators show a slowing buying pressure below 1,940 on the daily chart. Meanwhile, the hourly chart shows fluctuations and high volatility between 1,930 and 1,940.
Pivot Point: 1,940
| SUPPORT | RESISTANCE |
| 1,935 | 1,950 |
| 1,927 | 1,960 |
| 1,921 | 1,965 |
WTI Futures (CL-OIL)
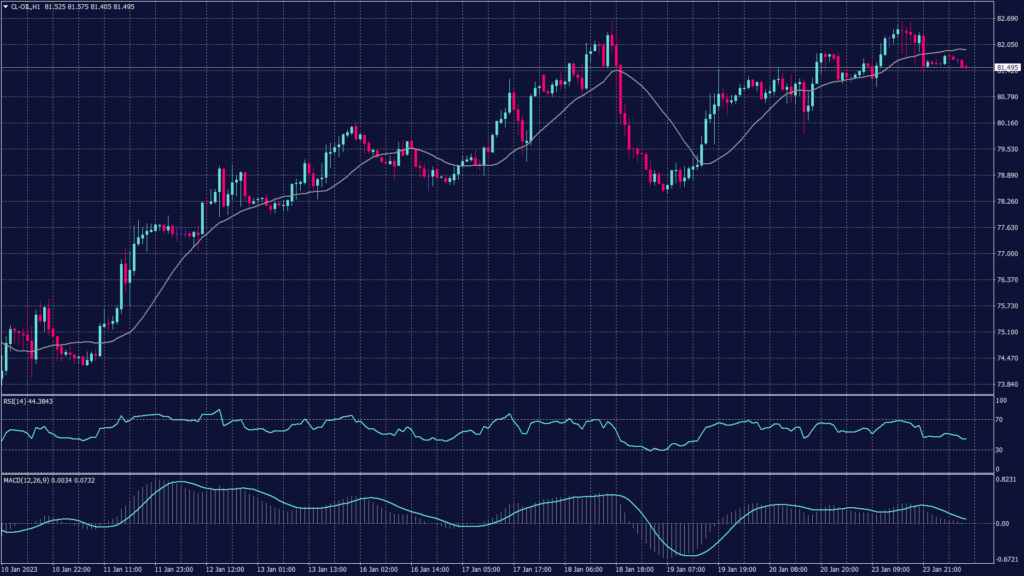
Crude oil prices rose slightly in early Asian trade on Tuesday in a market focused on prospects of demand recovery from top importer China and on the global economic outlook ahead of company earnings. Brent crude had risen to $88.24 per barrel, while WTI crude rose to $81.75 per barrel.
Investors have piled back into petroleum futures and options at the fastest rate in more than two years as concerns about a global business cycle downturn have eased. However, this week traders are watching for more business data that could indicate the health of global economies during an earnings reporting season.
Pivot Point: 81.50
| SUPPORT | RESISTANCE |
| 80.10 | 81.70 |
| 79.40 | 82.60 |
| 78.45 | 83.50 |
