

The Jackson Hole Symposium Day! Traders are closely awaiting Fed’s Chairman’s speech to cover the state of the US economy at the Jackson Hole Economic Symposium. Analysts expect the recent figures regarding inflation and the labor market will be shed light on, in addition to the monetary policy authority’s general outlook and its expectations regarding economic growth.
U.S. Dollar Index (USDX)
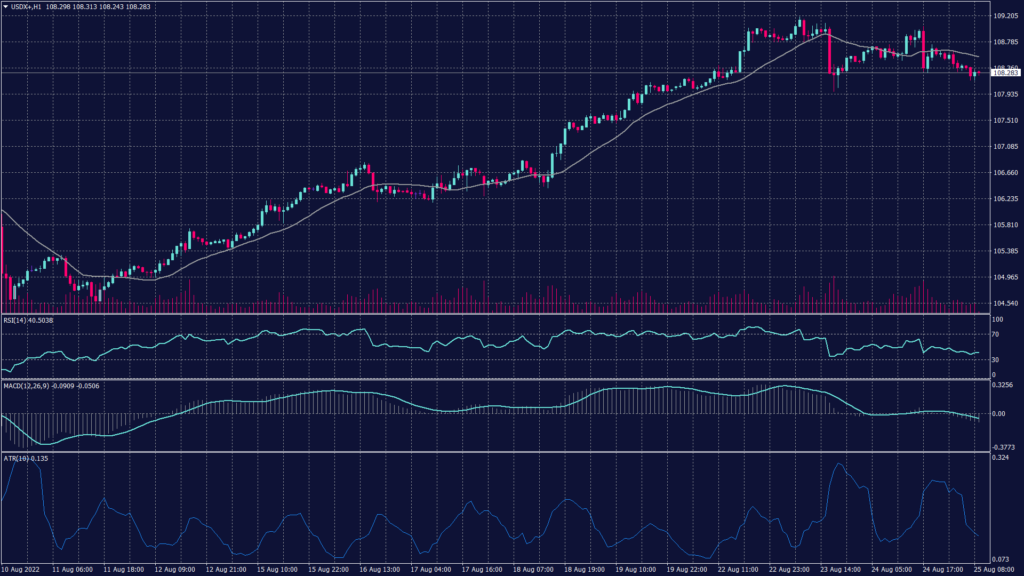
The U.S. dollar slipped back from a near two-decade peak against major currencies this morning. Moreover, investors are waiting for the speech by Fed Chair Jerome Powell the following day for new hints on the course of monetary policy. The dollar index shed 0.19% to 108.42 but remained not far from its highest since September 2002 at 109.29 it touched in mid-July.
Technically, the index lost the intraday momentum falling from its previous peak to the support at 108.25 at the time of writing this report. Meanwhile, Fibonacci retracement shows the support too far from the current levels on the hourly chart at 107.40. However, the price action shows support at 108.80 and 108.40. Also, technical indicators show a possibility of a drop due to the emotional resistance the index is facing at 109.20.
PIVOT POINT: 108.30
| SUPPORT | RESISTANCE |
| 108.00 | 108.55 |
| 107.90 | 108.75 |
| 107.40 | 108.90 |
Euro (EURUSD)
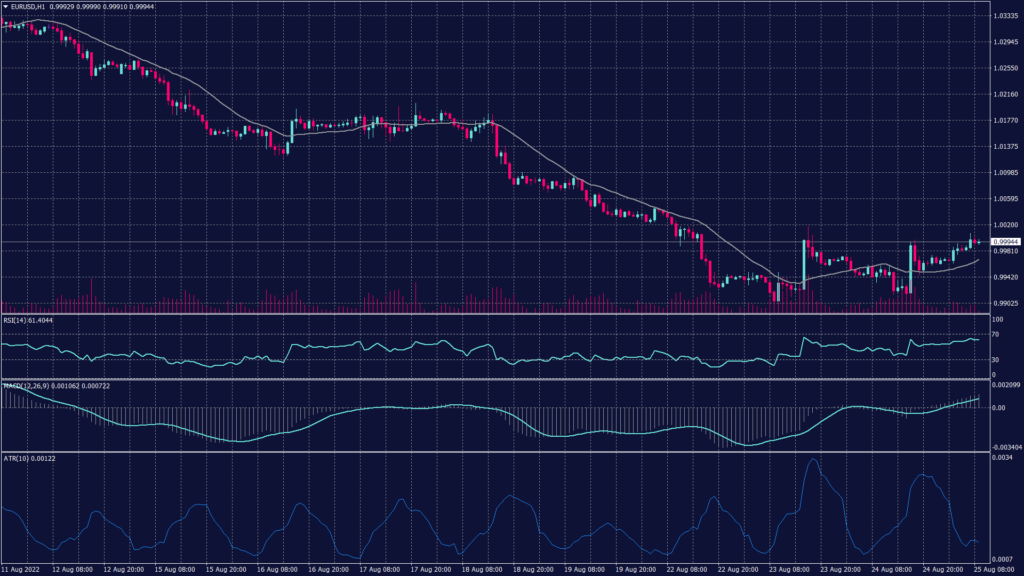
The European currency rebounds from the support at 0.9910 to exceed the parity levels as the greenback weakens. Technical indicators show a possibility for the continuation of the downtrend regardless of the RSI neutral level at the hourly chart. Meanwhile, the daily chart confirms the decline and remains to pressure the current levels towards 0.9850.
PIVOT POINT: 0.9990
| SUPPORT | RESISTANCE |
| 0.9950 | 0.9950 |
| 0.9850 | 0.9990 |
| 0.9800 | 1.0010 |
Spot Gold (XAUUSD)
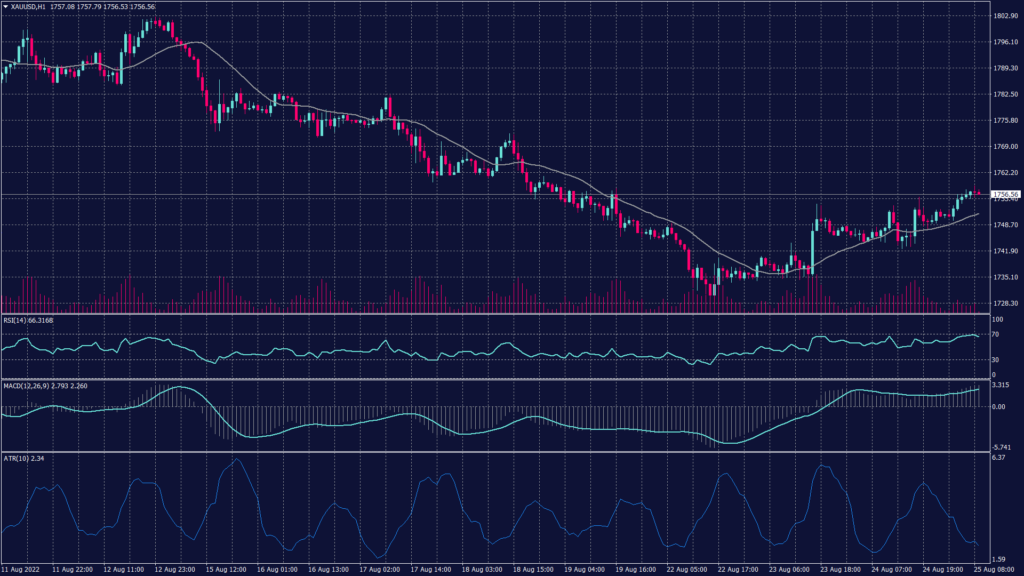
Gold prices moved little on Thursday but held on to recent gains as traders awaited more cues on U.S. monetary policy. Meanwhile, investors broadly expect the Chair to reiterate the bank’s hawkish stance, raising the little possibility that the Fed will reduce its rate of interest rate hikes.
Hawkish comments from several Fed officials have also reinforced expectations that the Fed will stick to its path of policy tightening. However, the central bank has raised rates four times so far this year. Furthermore, spot gold was little changed around $1,752 an ounce, while gold futures rose 0.2% to $1,765.0 an ounce.
Spot gold remains negative on both the daily and hourly time frames, but it shows a horizontal trend on the hourly chart. Meanwhile, the daily chart shows a sharper and clearer downtrend targeting levels near $1,700 per ounce.
PIVOT POINT: 1,758
| SUPPORT | RESISTANCE |
| 1,740 | 1,764 |
| 1,723 | 1,770 |
| 1,715 | 1,773 |
West Texas Crude (USOUSD)
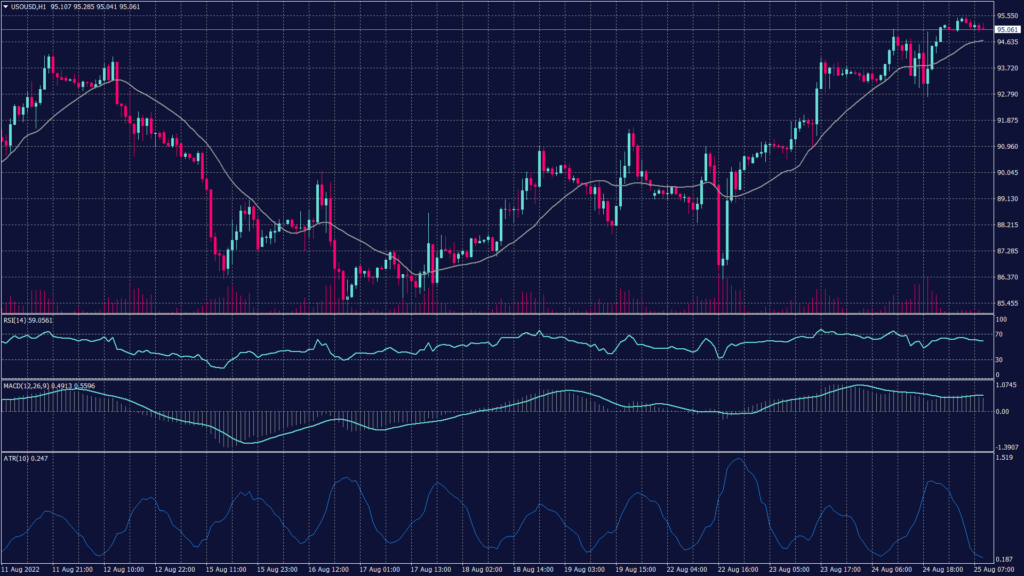
Oil prices rose on Thursday on mounting supply tightness concerns amid disruptions to Russian exports. However, Brent crude rose 0.6% to $101.81 a barrel, while WTI crude was up 0.4% at $95.31 a barrel. Moreover, Both crude oil benchmark contracts touched three-week highs on Wednesday after the Saudi energy minister flagged the possibility that the OPEC+ will cut production to support prices.
Technically, WTI rebounded from the support at 93.20 reaching above $94.50 per barrel and rising. However, the overall trend remains negative on the daily time frame unless prices broke above $96.20 per barrel which is the neckline of the double bottom on the daily chart.
PIVOT POINT: 95.00
| SUPPORT | RESISTANCE |
| 94.25 | 96.20 |
| 93.50 | 97.40 |
| 92.75 | 100.10 |
