

Market News Summary
Last week, U.S. debt hit an all-time high at $33 trillion amid inflation and a massive wave of treasury bonds. Treasury Secretary Janet Yellen often looks at the ‘net interest’ gauge as a percentage of GDP to assess the United States’ financial health.
In Japan, the Bank of Japan may need to raise interest rates sooner than expected if the value of the Japanese Yen weakens beyond 150 Yen against the dollar, according to Bob Michel, Global Head of Fixed Income at JPMorgan Asset Management.
Dollar Index (USDX)
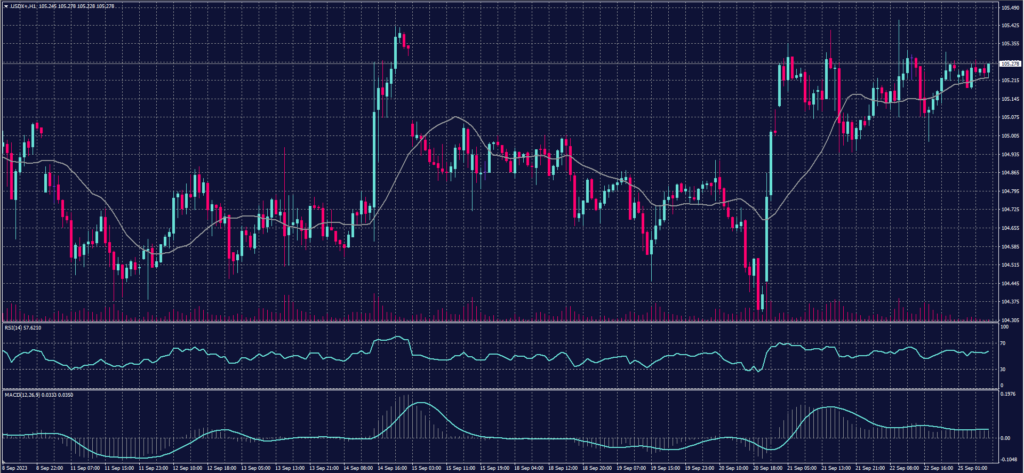
The dollar held firm after a series of economic data and news last week supported the continuation of monetary tightening. The US Dollar Index is currently trading around its pivotal point at $105.30.
Markets are awaiting important data this week, including Federal Reserve Chair Powell’s speech and the US Gross Domestic Product (GDP), which is expected to rise by 0.2% to 2.3%.
Pivot point: 105.25
| Resistance level | Support level |
| 105.50 | 105.00 |
| 105.70 | 104.75 |
| 105.95 | 104.55 |
Spot Gold (XAUUSD)
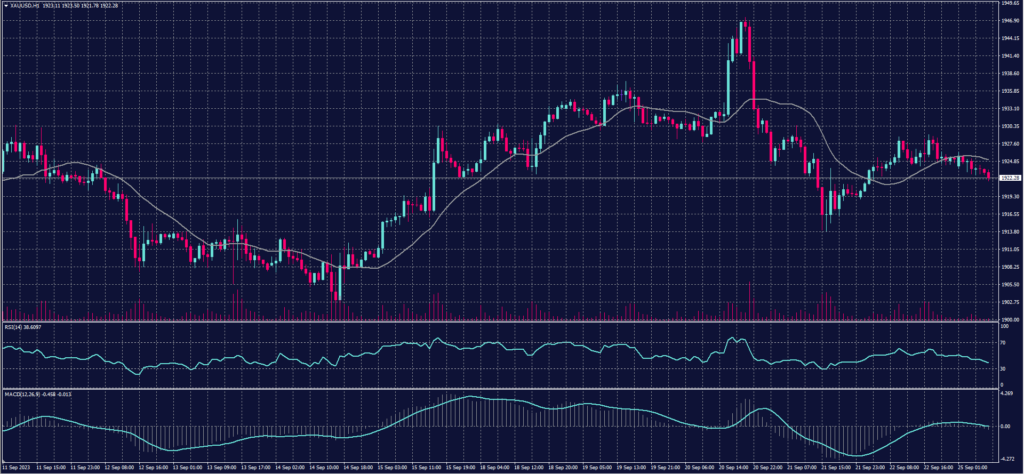
Gold prices rose at Friday’s close, supported by a slight decline in the dollar and US bond yields as investors digested the Federal Reserve’s hawkish stance.
However, these gains did not last after the dollar regained control during the Asian session today, with gold prices now trading lower around the 1921 level, below its pivotal point.
Pivot point: 1924
| Resistance level | Support level |
| 1929 | 1919 |
| 1934 | 1914 |
| 1940 | 1909 |
Dow Jones Index (DJ30ft – US30)
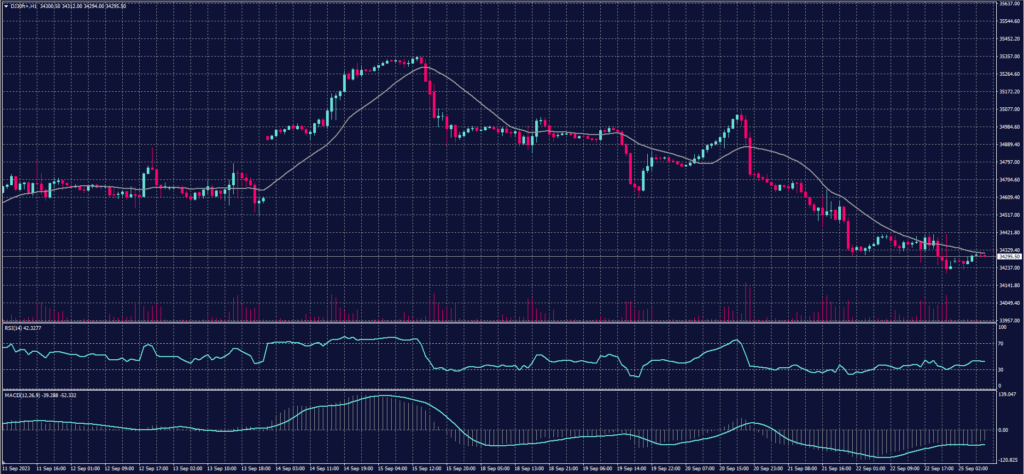
US indices continue their collective losses as the idea of monetary tightening lingers in the markets, even after investors tried to digest it at Friday’s close.
The Dow Jones Index now hovers around the 34,295 dollar level, near its pivotal point.
Pivot point: 34290
| Resistance level | Support level |
| 34370 | 34160 |
| 34490 | 34080 |
| 34580 | 33950 |
US Crude Oil (USOUSD)
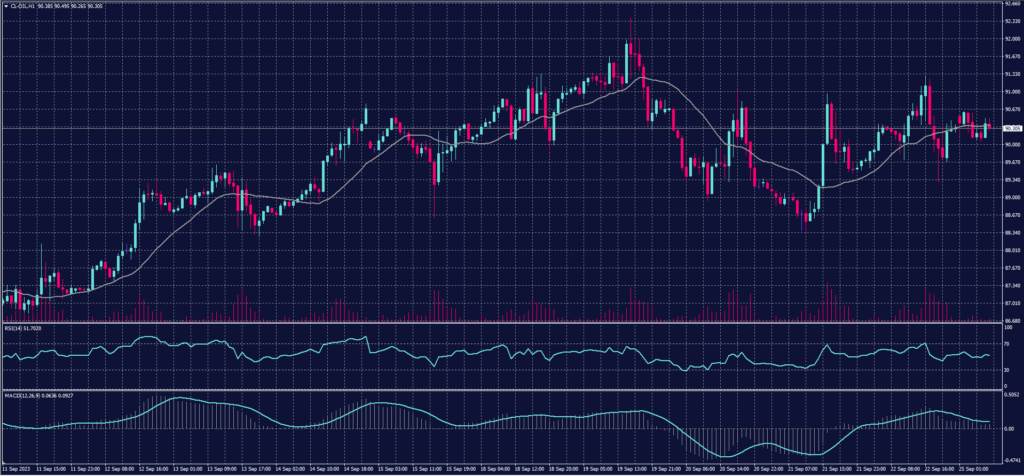
Oil prices rose on Monday, September 25th, as investors focused on supply concerns after Moscow imposed a temporary ban on fuel exports amid ongoing concerns about another interest rate hike, which could weaken demand.
Brent crude futures climbed by 48 cents or 0.5% to $93.75 per barrel, while West Texas Intermediate (WTI) crude futures extended their gains for a second consecutive session, trading at $90.53 per barrel, up by 50 cents or 0.6%.
Pivot point: 90.30
| Resistance level | Support level |
| 91.30 | 89.30 |
| 92.30 | 88.30 |
| 93.35 | 87.35 |
Risk Warning
This article provides real-time market analysis from contributing analysts. Please note that any views expressed in this article do not constitute operational advice. It is important to assess your risk tolerance and make independent trading decisions. STARTRADER holds no responsibility for any trading consequences that may arise from relying on the views expressed in this article.
