

MARKET NEWS SUMMARY
Novavax shares fell more than 25% in Wednesday session, its lowest close in nearly two years. These pressures on the stock come after the Corona vaccine developer raised doubts about its ability to continue to work and announced plans to cut spending while preparing for the fall vaccination campaign.
Bank of America believes that the ability of artificial intelligence to benefit from data may boost the global economy by up to $ 15.7 trillion by 2030. Moreover, they believe that the value of the artificial intelligence market may jump to $ 900 billion by 2026.
According to data from the International Energy Agency, the value of Russia’s oil and gas exports fell to $18.5 billion in January, a decline of 38% compared to 2022 levels, when it recorded $30 billion.
Fatih Birol, director of the agency, said: Our expectations are that the decline in oil and gas revenues will be larger in the coming months, and even more severe in the medium term due to the lack of access to investments and technology.
Dollar index (USDX)
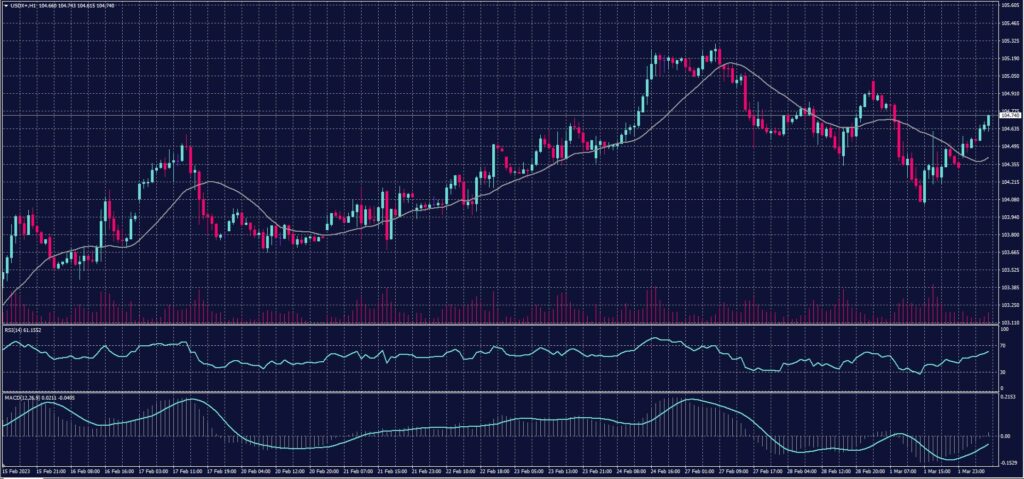
The dollar incurred losses on Thursday, March 2, as optimism about the reopening of China received support from encouraging data and strengthened the Asian currencies. After 10 o’clock Dubai time, positive technical readings returned on to the dollar index, starting from trend indicators with the upward intersection of moving averages and reading the EMA indicator. Moreover, there is positive momentum today.
Pivot Point: 104.45
| Resistance level | Support level |
| 104.60 | 104.25 |
| 104.80 | 104.10 |
| 105.30 | 103.80 |
Euro (EURUSD)
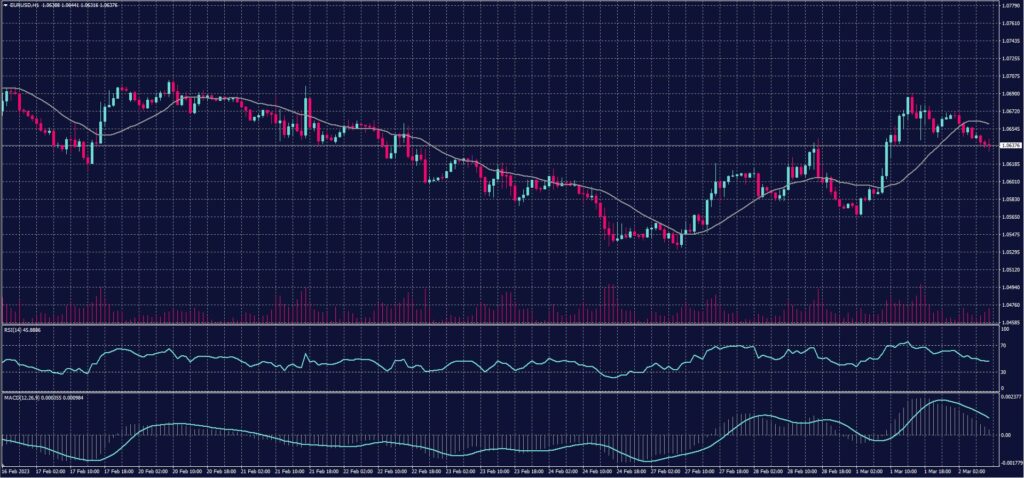
The euro rose 1.2% over the course of the week, last trading at $1.0667 considering higher-than-expected German inflation in February, which increased pressure on the European Central Bank to raise interest rates after unexpectedly strong readings in France and Spain.
Inflation data for the eurozone is due later today.
Pivot Point: 1.0640
| Resistance level | Support level |
| 1.0715 | 1.0590 |
| 1.0765 | 1.0520 |
| 1.0810 | 1.0455 |
Spot Gold (XAUUSD)
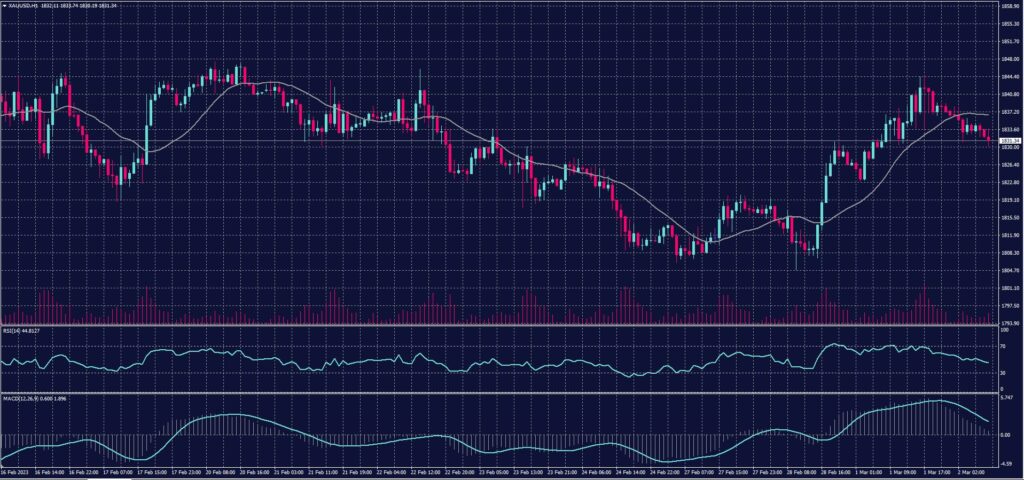
Gold prices fell on Thursday, March 2, as the dollar rose, while a new set of global economic data reinforced investor concerns about interest rates remaining high for longer than expected.
Gold fell in spot transactions by 0.2% to 1833.57 dollars an ounce, after reaching the highest level in a week yesterday, Wednesday, and US gold futures fell 0.3% to 1840.50 dollars.
Although considered a hedge against inflation, raising interest rates to dampen prices increases the opportunity cost of holding non-yielding precious metals.
Pivot Point: 1,835
| Resistance level | Support level |
| 1,846 | 1,825 |
| 1,856 | 1,814 |
| 1877 | 1,803 |
Dow Jones Index (DJ30ft – US30)
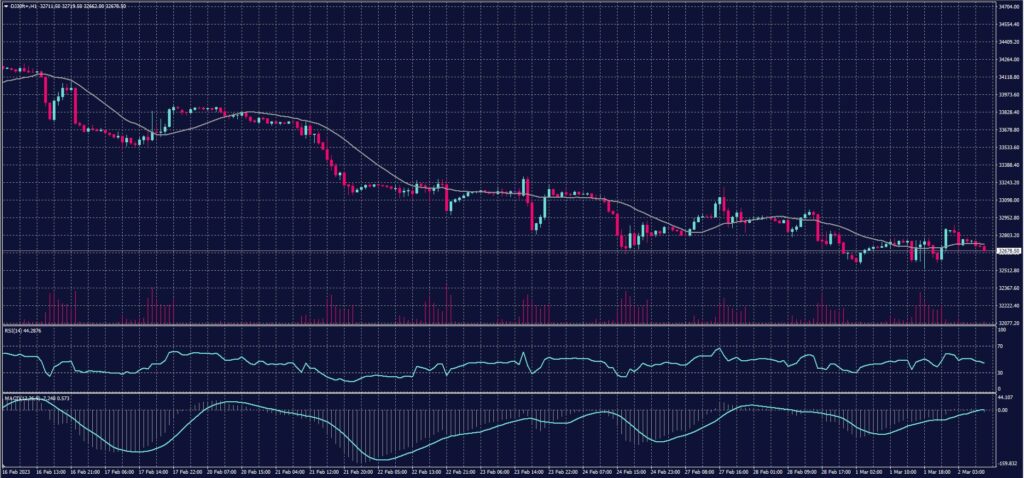
US indices fell in the Wednesday session, under pressure from the rise in bond yields to historical levels, after manufacturing data indicated an increase in inflation rates, as the Institute for Supply Management survey showed a contraction in manufacturing in the United States in February and an increase in raw material prices last month, which led to a rise in the yield of 10-years US Treasury bonds, touching 4% levels for the first time in 4 months, the two-year US Treasury bond yield jumped to its highest level in more than 15 years, after touching 4.9% levels.
The Dow Jones index closed flat at 32,661 points, remaining near its lowest level in 4 months. Morning losses for the Dow narrowed, with Caterpillar stock rising 3.3% after the construction equipment maker said it had reached a preliminary agreement with a union to represent workers at four of its facilities.
Pivot Point: 32745
| Resistance level | Support level |
| 32960 | 32625 |
| 33080 | 32410 |
| 33415 | 32075 |
US Crude OIL (USOUSD)
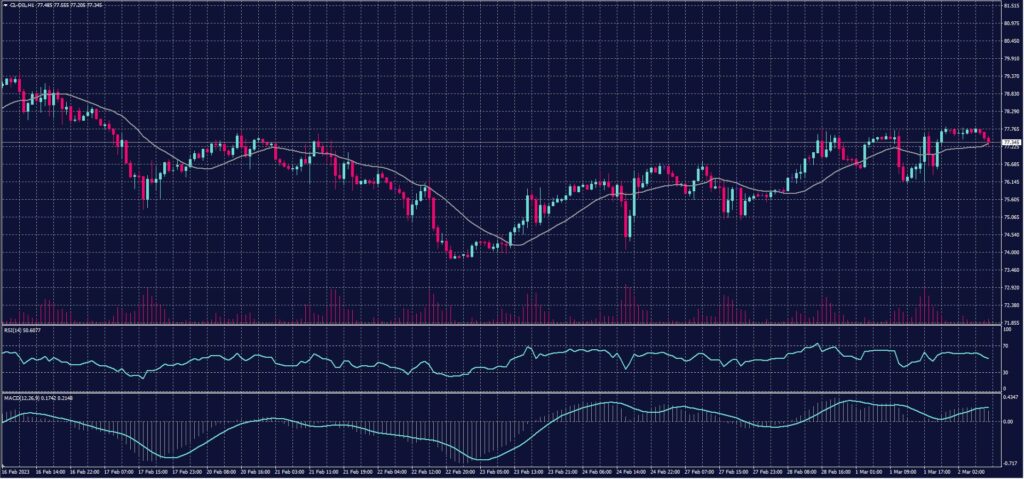
Oil prices rose in early Asian trading, Thursday, March 2, to continue achieving gains since the previous two sessions, amid indications of a strong economic recovery in China, the world’s largest oil importer, which offset the impact of concerns about rising US crude stocks.
Brent crude futures rose 12 cents, or 0.1%, to $84.43 a barrel, while US West Texas Intermediate crude futures rose 7 cents, or 0.1%, to $77.76 a barrel.
The two crude futures rose about 1% in the previous session, after data showed that manufacturing activity in China in February grew at the fastest pace in more than a decade, in new evidence of economic recovery after the removal of strict Covid-19 restrictions.
Pivot Point: 77.20
| Resistance level | Support level |
| 78.30 | 76.60 |
| 78.90 | 75.50 |
| 80.00 | 74.00 |
