

market news summary
China’s exports contracted more than expected in June, affected by a global demand slump, and increasing concerns about the world’s second-largest economy. Customs data showed that the value of Chinese exports in dollars fell by 12.4% in June compared to the previous year, and imports decreased by 6.8% in June from the previous year, both worse than expected.
Data released yesterday showed that US consumer prices rose slightly on a monthly basis in June, marking the lowest annual increase in over two years, as inflation continued to decline on a yearly basis.
Markets expect another interest rate hike but also speculate that the cycle of rate hikes in the United States may have reached its peak.
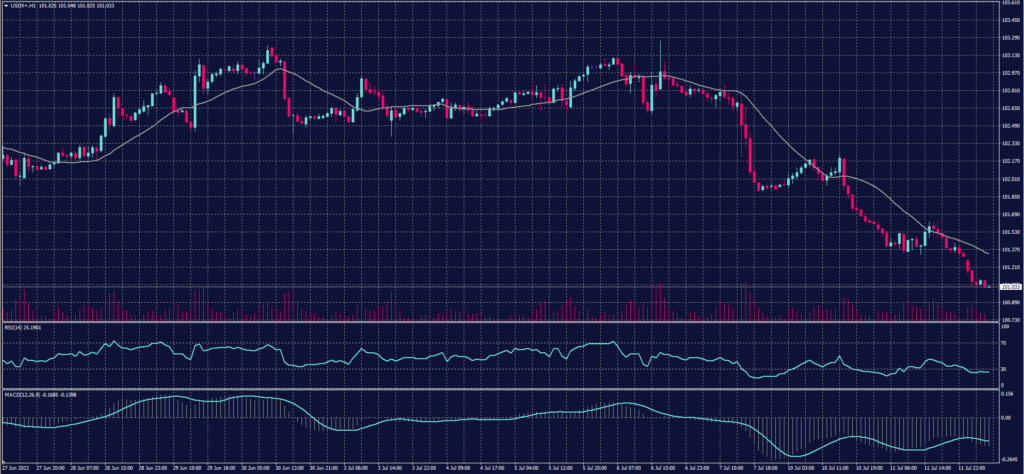
Dollar Index (USDX)
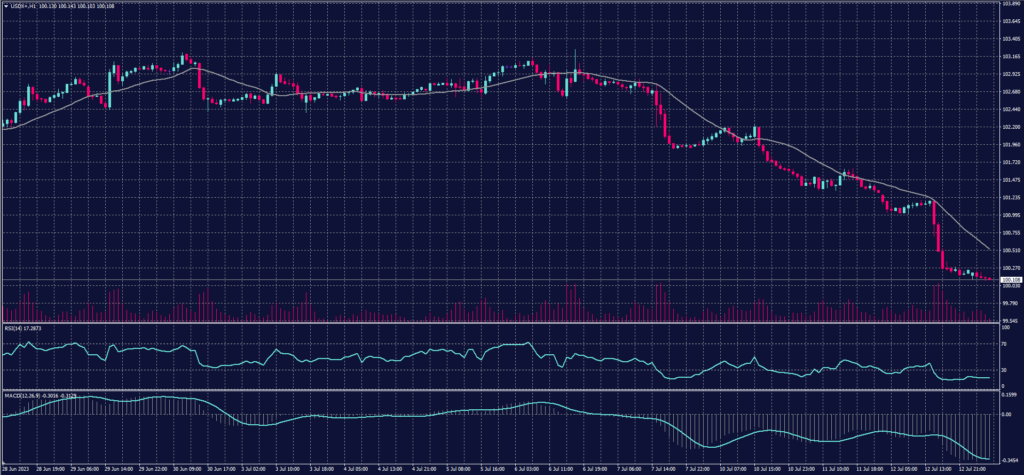
Inflation in the United States came in much lower than previous figures and slightly below expectations of most economists yesterday, indicating that the Federal Reserve will likely be less aggressive in tightening monetary policy to curb price growth, even if the central bank stays on its course.
The dollar fell to 100.10, the lowest level in over 15 months.
Pivot point: 100.55
| Resistance level | Support level |
| 99.80 | 100.95 |
| 99.45 | 101.65 |
| 98.75 | 102.00 |
Spot Gold (XAUUSD)
Gold prices rose during Wednesday’s trading session as the US dollar weakened following lower-than-expected US inflation figures.
At the close, spot gold contracts increased by approximately $22 to $1,955 per ounce and reached levels of $1,961 today.
Pivot point: 1949
| Resistance level | Support level |
| 1967 | 1939 |
| 1977 | 1921 |
| 1995 | 1911 |
Dow Jones Index (DJ30ft – US30)
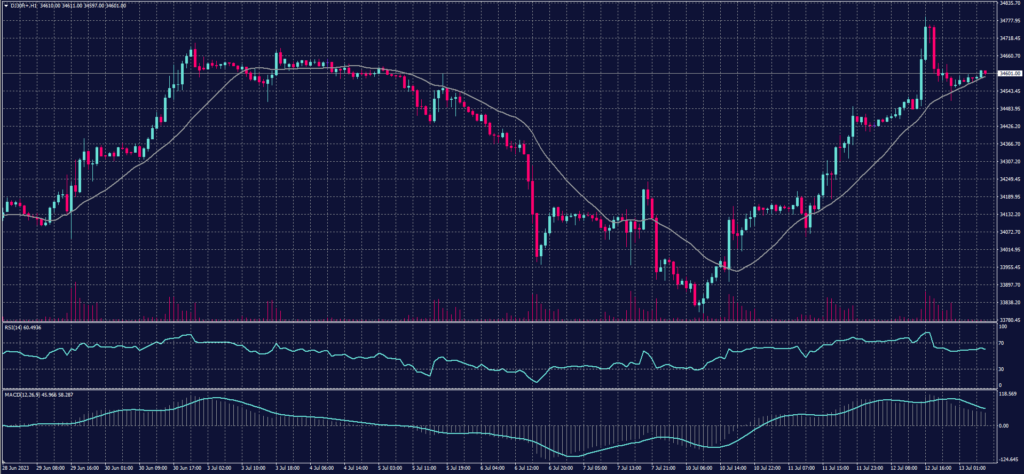
US indices closed with strong gains in Wednesday’s session after the inflation rate in June recorded its lowest annual increase in over two years. The inflation data confirmed expectations that the Federal Reserve may halt interest rate hikes after an anticipated additional 25 basis points rise at the July meeting.
The Dow Jones Industrial Average rose by 0.25%, equivalent to approximately 86 points, marking its third consecutive daily increase. The S&P 500 also rose by about 0.7%, reaching its highest closing level in 15 months.
Pivot point: 34585
| Resistance level | Support level |
| 34765 | 34385 |
| 34965 | 34205 |
| 35145 | 34000 |
US Crude OIL (USOUSD)
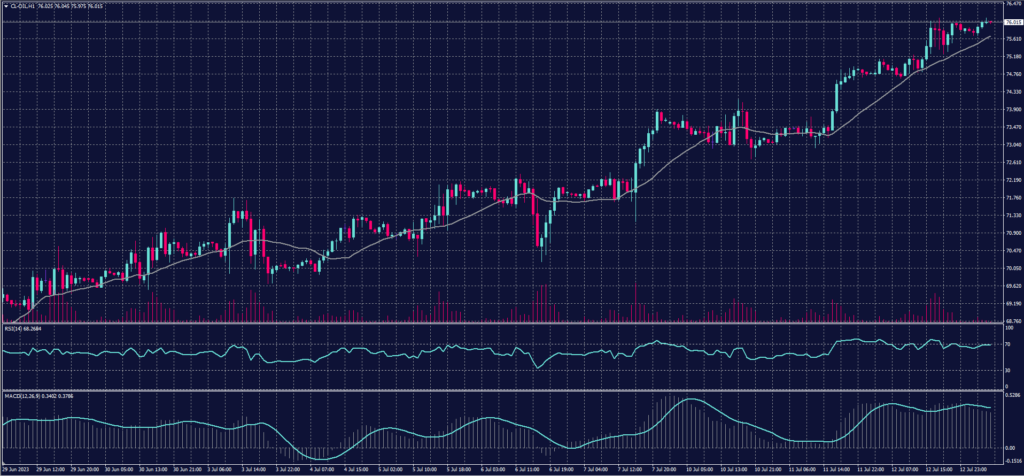
Oil prices rose during Wednesday’s session, with Brent crude reaching $80 per barrel for the first time since May, as inflation data in the United States boosted hopes that the Federal Reserve may raise interest rates less frequently in the future.
Futures for Brent crude increased by 71 cents or 0.9% to $80.11 per barrel at the close. Meanwhile, futures for West Texas Intermediate rose by 92 cents or 1.2% to $75.75 per barrel.
Pivot point: 75.55
| Resistance level | Support level |
| 76.40 | 74.95 |
| 77.00 | 74.05 |
| 77.90 | 73.50 |
Risk Warning
This material provides real-time market analysis from contributing analysts. Please note that any views expressed in this material do not constitute operational advice. It is important to assess your risk tolerance and make independent trading decisions. STARTRADER holds no responsibility for any trading consequences that may arise from relying on the views expressed in this material.
