

The U.S. dollar was steady this morning as the dollar index traded around 112 during the Asian session. Meanwhile, the sterling pound jumped to 1.14 as investors await clarity after the resignation of former Prime minister Liz Truss.
On the Other hand, the Japanese yen rebounded to 147.3 amid reaching its lowest level since 1999 at 151.93. The Japanese central bank intervened by selling $30 billion to control the currency exchange rate. On crude oil, WTI slightly gained to $85 a barrel amid the Chinese GDP data showing 3.9% growth. Additionally, gold gained to $1,662 per ounce as recessionary fears increased.
U.S. Dollar Index (USDX)
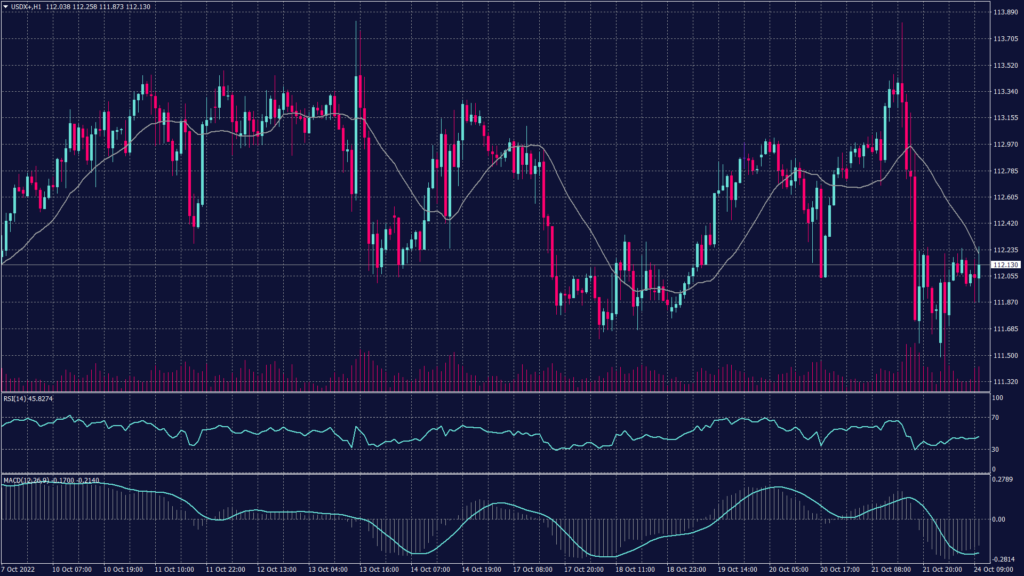
The U.S. dollar edged higher in early European trades, absorbing suspected intervention by the Bank of Japan, while sterling pushed higher as former finance minister Rishi Sunak looked likely to become Britain’s prime minister.
On the hourly chart, the Index remains solid above 112 and heading toward the resistance at 112.35. Meanwhile, technical indicators show a possible continuation of the uptrend above 112.35. Meanwhile, the daily chart shows a continuation of the positive trend and is supported above 111.60. Technical indicators move in a neutral fashion.
Pivot Point: 112.30
| SUPPORT | RESISTANCE |
| 112.00 | 112.50 |
| 111.75 | 112.80 |
| 111.50 | 113.00 |
Sterling Pound (GBPUSD)
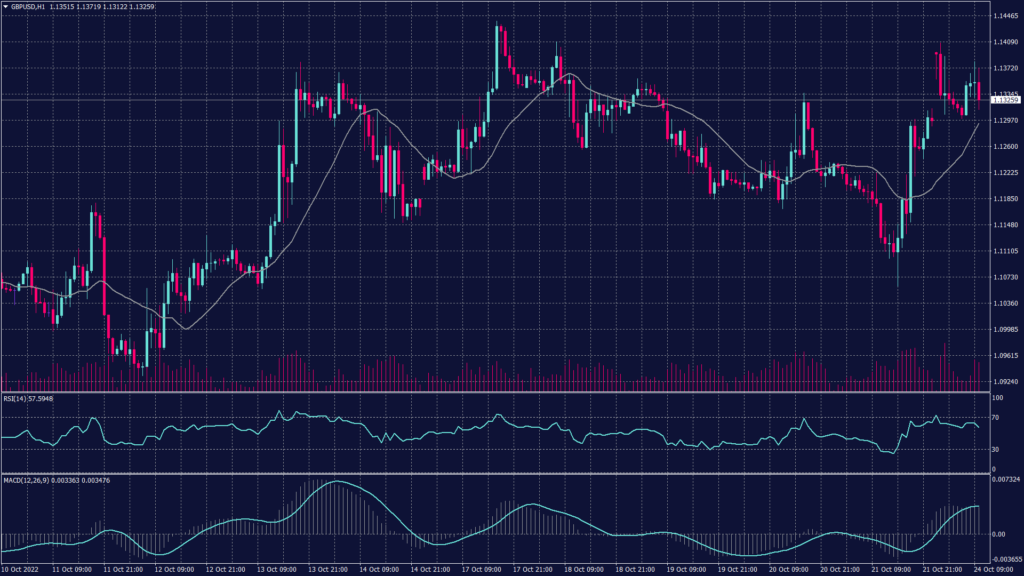
The Cable rose 0.4% to 1.1347, after former prime minister Boris Johnson pulled out of the running to replace the outgoing Liz Truss, with the Conservative Party due to announce its new leader, and thus PM, later Monday.
Johnson’s decision means that former finance minister Rishi Sunak, seen as the most fiscally prudent option, is likely to win power. His appointment would likely reduce the political uncertainty hanging over the pound, for a little time at least.
The pound remains inside the negatively trending channel despite the fluctuations above 1.1250. The hourly chart shows support at 1.1200 while the gap between 1.1180 and 1.1210 indicates weak momentum. On the other hand, the daily chart shows a continuation of the downtrend towards 1.0440
Pivot Point: 1.1300
| SUPPORT | RESISTANCE |
| 1.1270 | 1.1350 |
| 1.1200 | 1.1370 |
| 1.1130 | 1.1400 |
Japanese Yen (USDJPY)
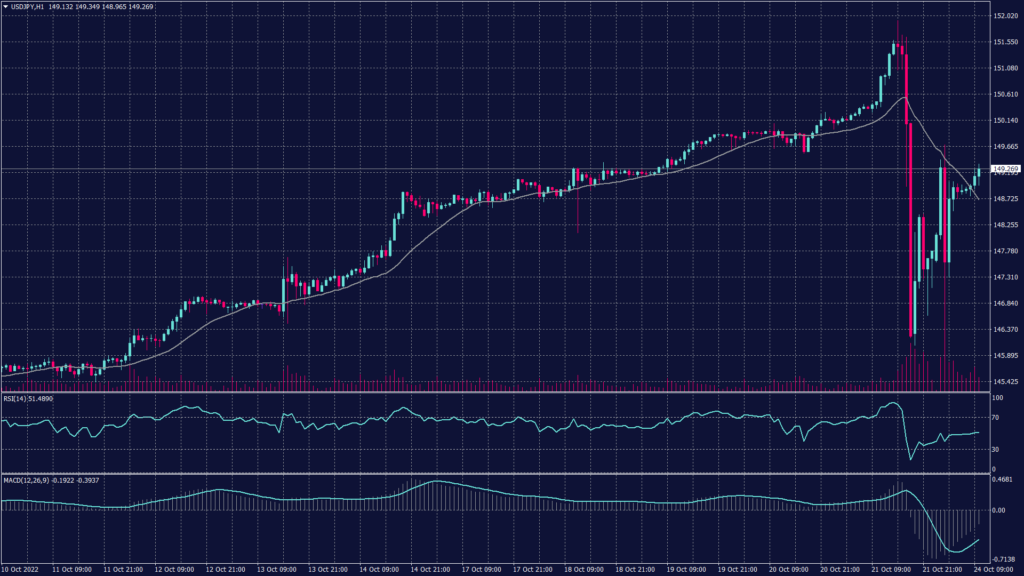
The Financial Times reported the Bank of Japan may have sold at least $30 billion on Friday in an effort to support the yen, and the pair’s volatile movements early Monday action strongly suggested that the Japanese authorities had been in again.
USDJPY fell from a high of 149.68 to 145.28 in a move that suggested intervention. However, it has climbed back up to 149.20, indicating that the Japanese authorities have a lot of work to do to stem the demand for the dollar versus the beleaguered yen.
Pivot Point: 149.20
| SUPPORT | RESISTANCE |
| 149.00 | 149.75 |
| 148.80 | 150.00 |
| 148.40 | 150.50 |
Spot Gold (XAUUSD)
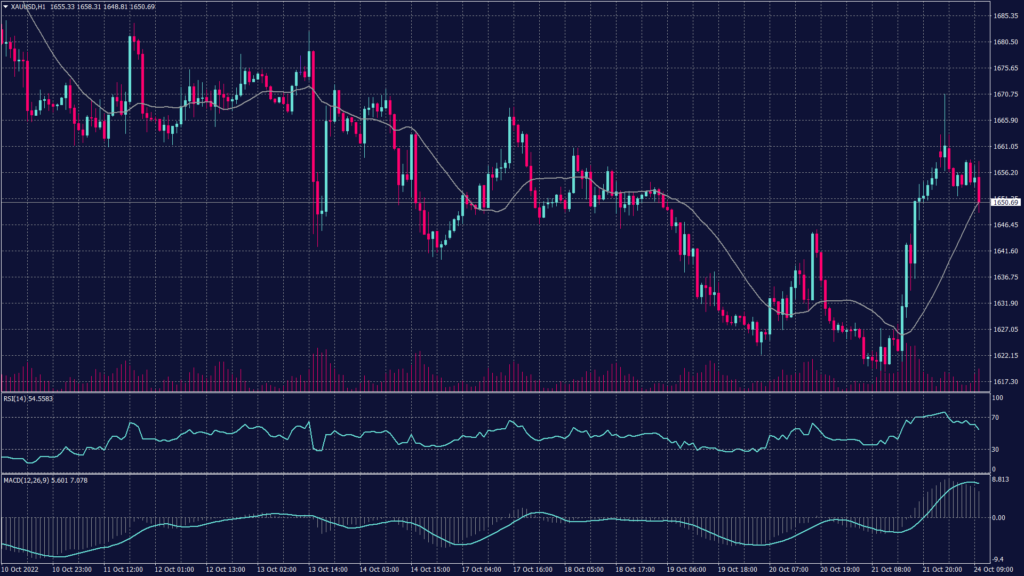
Gold’s futures settled Friday up 1.2% and trade at $1,656.30 an ounce, while gold’s spot price was at $1,654.24 per ounce. Gold prices are heading downwards on the hourly chart reaching the support at $1,665 per ounce. However, the current support is not strong enough to hold against the current selling pressure which might break the supports at 1,665 and 1,659 to head towards 1,650.
Meanwhile, the daily chart remains within the downtrend channel heading towards 1,620 on the foreseen time frame.
Pivot Point: 1,645
| SUPPORT | RESISTANCE |
| 1,640 | 1,650 |
| 1,635 | 1,655 |
| 1,630 | 1,665 |
West Texas Crude (USOUSD)
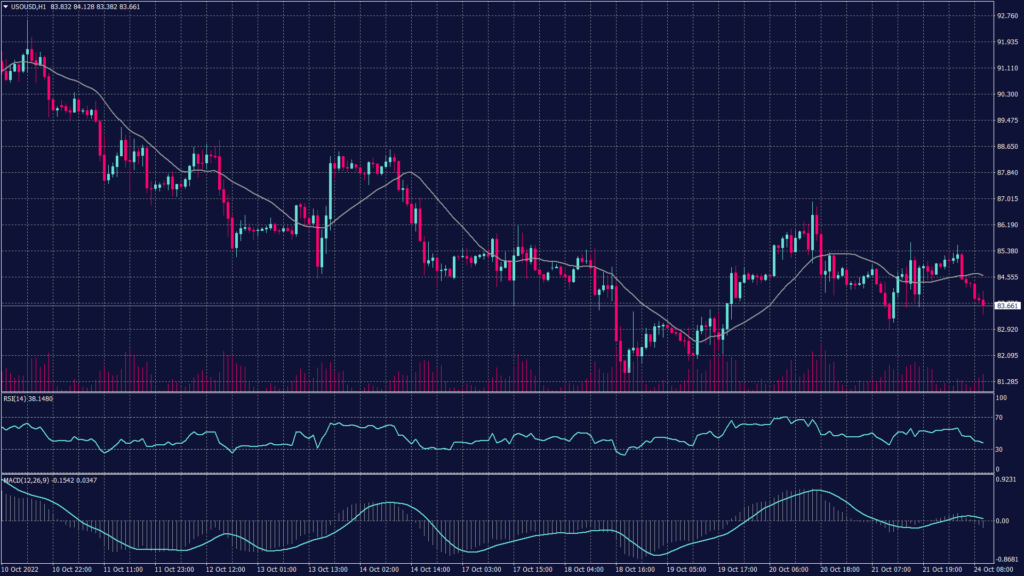
Oil prices fell on Monday after China released the delayed trade data that showed the demand in the world’s largest crude importer remained low in September as strict COVID-19 policy and fuel export curbs depress consumption. Brent futures slid 0.4% to $93.10 a barrel after rising 2% last week. Meanwhile, WTI was traded at $84.66 per barrel, down 0.5%.
Despite rising from August, China’s crude imports in September of 9.79 million barrels per day were 2% below the amount brought in a year earlier, customs data showed on Monday, as independent refiners curbed throughput amid thin margins and dull demand.
The WTI chart shows a downward trend on the daily chart while trading right above the support at 83.80. However, the technical indicators show a chance of fluctuations between 82.50 and 83.80 before deciding the actual trend. The hourly chart on the other hand is moving below the 20 and 50 periods moving average, indicating a high possibility of a negative trend continuation.
Pivot Point: 82.75
| SUPPORT | RESISTANCE |
| 82.15 | 83.80 |
| 81.30 | 84.70 |
| 79.50 | 85.70 |
