

Market News Summary
The European Stoxx 600 index rose to its highest level in over a month yesterday, thanks to a slowdown in inflation in major economies, bolstering bets on ending the tightening monetary policy pursued by central banks.
After a report indicating stability in inflation in the United States, new data showed that UK inflation slowed more than expected in October. At the same time, German wholesale prices witnessed their largest decline in nearly three and a half years in October, another sign of declining inflationary pressures in the largest economy in Europe.
Dollar Index (USDX)
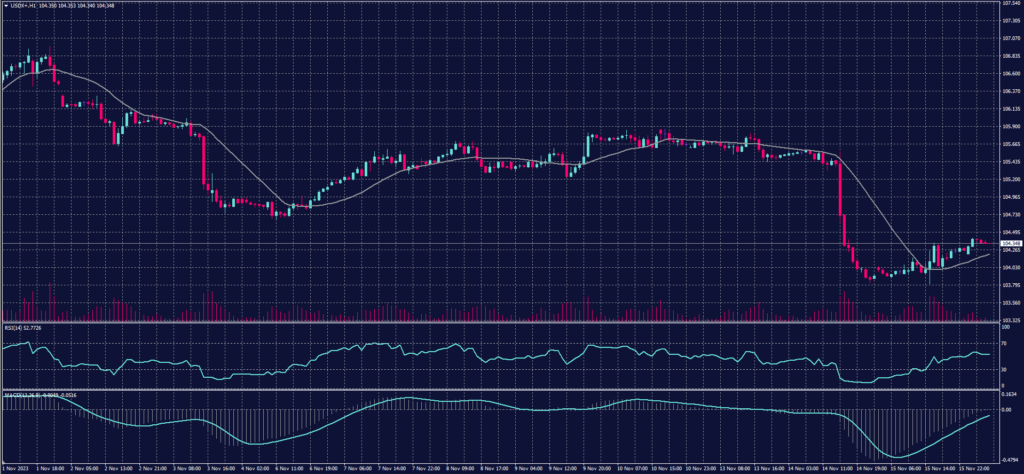
Following positive inflation data on Tuesday, supplementary figures released yesterday, Wednesday, revealed the most significant decline in producer prices in three and a half years in October. This drop is linked to a decrease in gasoline prices, offering additional confirmation of the alleviation of price pressures.
Additionally, retail sales data showed a less-than-expected decrease of 0.1% in October, compared to expectations of a 0.3% decline.
Pivot Point: 104.15
| Resistance level | Support level |
| 104.45 | 103.90 |
| 104.70 | 103.60 |
| 105.00 | 103.35 |
Spot Gold (XAUUSD)
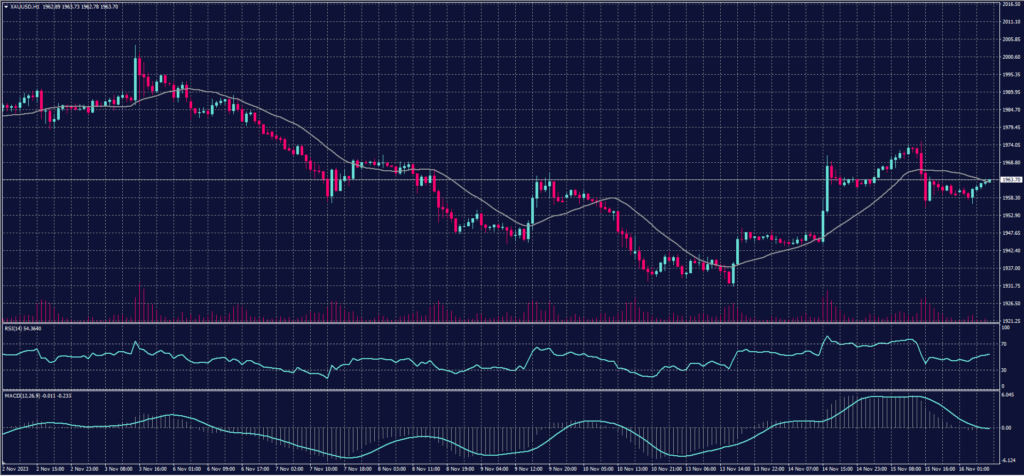
On Wednesday, gold prices rose to their highest level in over a week, driven by a weakening dollar and declining US Treasury bond yields. This came after data indicating a decrease in inflation, fuelling speculation that a cut in US interest rates may occur sooner than anticipated by investors.
Gold in spot transactions increased by 0.4% to $1970.45 per ounce, while US futures for gold rose by 0.4% to $1974.70 per ounce.
Pivot Point: 1963
| Resistance level | Support level |
| 1971 | 1951 |
| 1983 | 1943 |
| 1990 | 1931 |
Dow Jones Index (DJ30ft – US30)
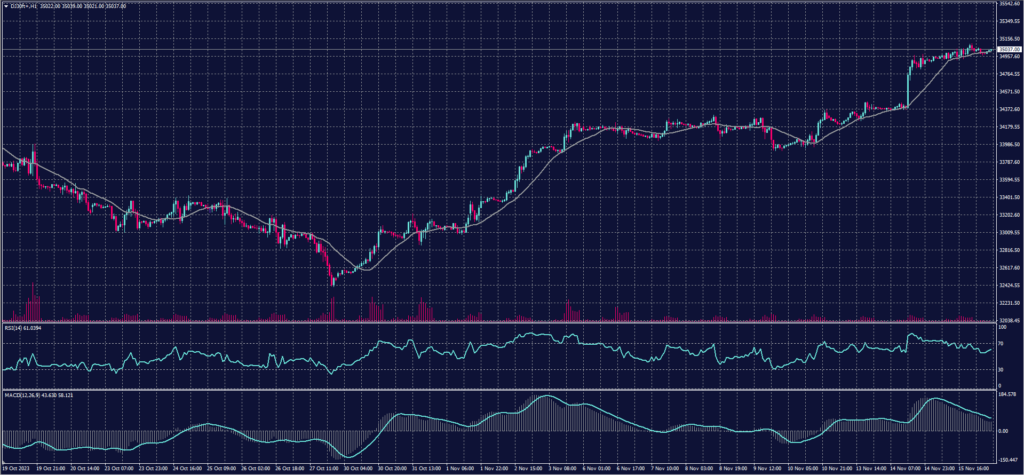
On Wednesday, US indices closed with modest gains, bolstered by economic data that reinforced investor optimism that the Federal Reserve had completed its interest rate hikes.
The Dow Jones index rose by approximately 0.5%, equivalent to 163 points, marking its highest daily close in three months. Additionally, the S&P 500 and Nasdaq indices increased by 0.15% and 0.1%, respectively, recording their fourth consecutive daily gains.
Pivot Point: 35005
| Resistance level | Support level |
| 35115 | 34910 |
| 35210 | 34800 |
| 35320 | 34705 |
US Crude Oil (USOUSD)
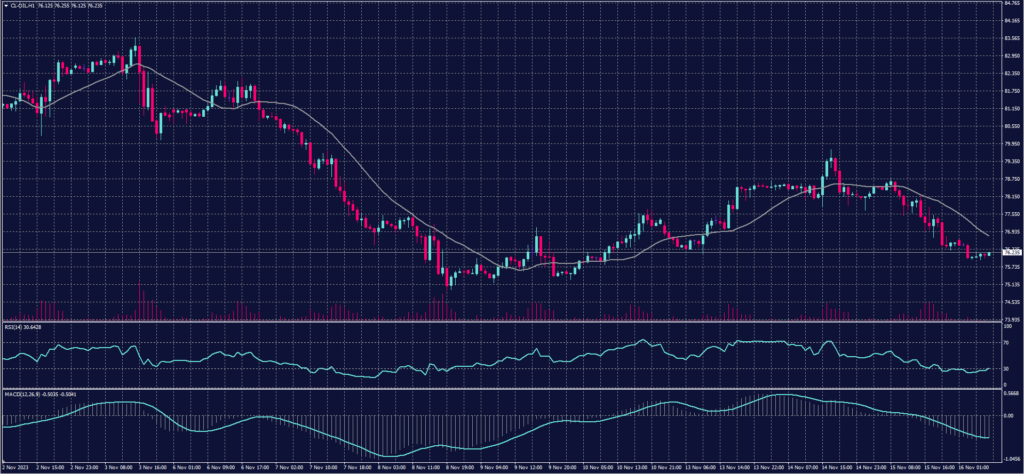
Yesterday, Wednesday, oil prices declined by more than 1.5% at settlement, driven by a higher-than-expected increase in crude oil inventories in the United States, reaching a record production level. Additionally, concerns grew about demand volume in Asia.
Brent crude futures dropped by $1.29, or 1.6%, to $81.18 per barrel. Meanwhile, West Texas Intermediate (WTI) crude fell by $1.6, or 2%, to $76.66 per barrel.
Pivot Point: 77.20
| Resistance level | Support level |
| 78.10 | 75.65 |
| 79.65 | 74.75 |
| 80.55 | 73.20 |
Risk Warning
This article provides real-time market analysis from contributing analysts. Please note that any views expressed in this article do not constitute operational advice. It is important to assess your risk tolerance and make independent trading decisions. STARTRADER holds no responsibility for any trading consequences that may arise from relying on the views expressed in this article.
