

Market News Summary
The Bank of Japan kept interest rates unchanged at 0.1% during its meeting and confirmed that the target level for 10-year Japanese government bond yields will remain at 0%, but it will take a range of up to 1% as a reference.
On Monday, the U.S. Treasury Department stated that it expects to borrow $776 billion in the fourth quarter, which is $76 billion less than its July projections, citing increased revenue estimates, bringing some stability to the bond market that has been fluctuating for months due to the new debt surplus.
Dollar Index (USDX)
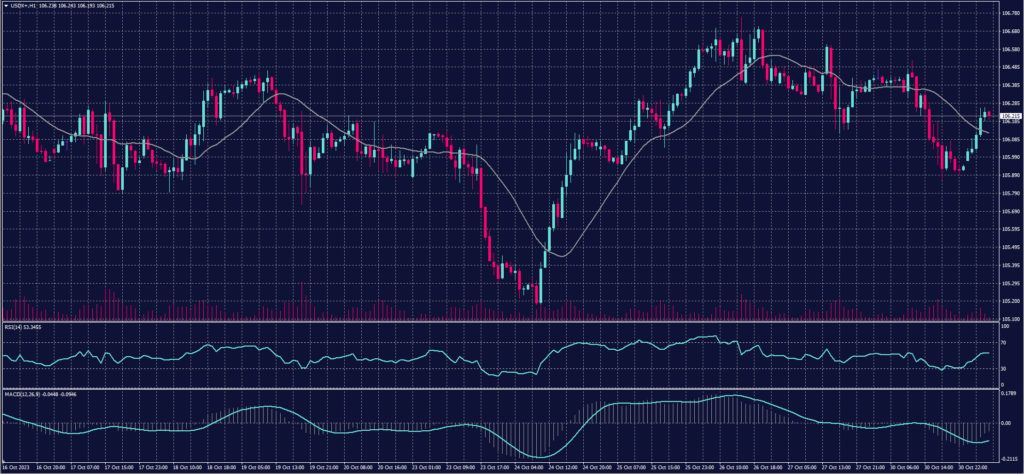
Wall Street is also closely monitoring the upcoming decision by the Federal Reserve regarding interest rates on Wednesday. Federal funds futures pricing indicates an almost 98% probability that the Fed will keep interest rates at their current levels.
The dollar index is trading positively above its pivot point at $106.20.
Pivot Point: 106.10
| Resistance level | Support level |
| 106.35 | 105.70 |
| 106.75 | 105.45 |
| 107.00 | 105.05 |
Spot Gold (XAUUSD)
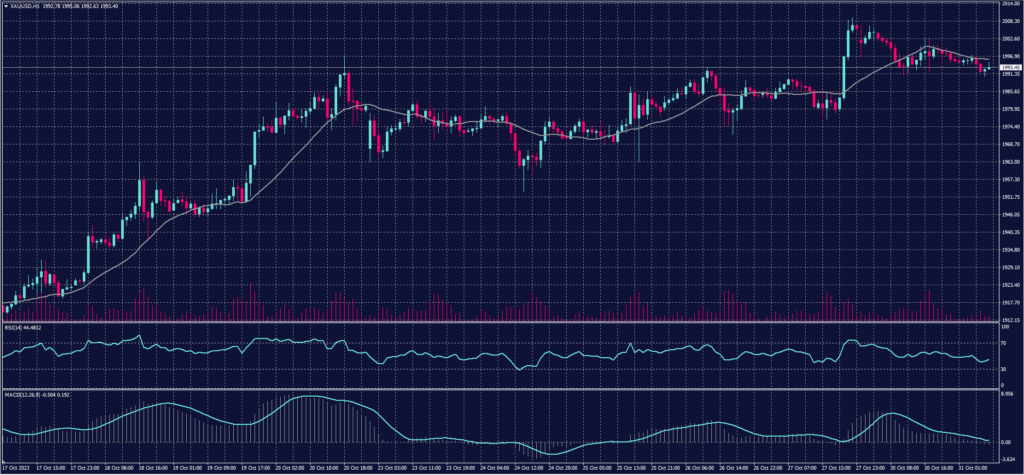
Gold stabilized on Tuesday, October 31, ahead of central bank meetings this week that could provide insights into the global economy and monetary policy outlooks. However, the safe-haven metal is poised to achieve its best monthly performance in almost a year amid the conflict between Israel and Hamas.
Gold rose in spot trades to as high as $2009.29 per ounce on Friday, marking its highest level since mid-May, as investors sought safety amidst the Middle East crisis. However, gold in spot trades decreased by 0.1% to $1994.15 per ounce at the day’s close. U.S. gold futures fell by 0.1% to $2003.60.
Pivot Point: 1997
| Resistance level | Support level |
| 2004 | 1988 |
| 2013 | 1981 |
| 2020 | 1972 |
Dow Jones Index (DJ30ft – US30)
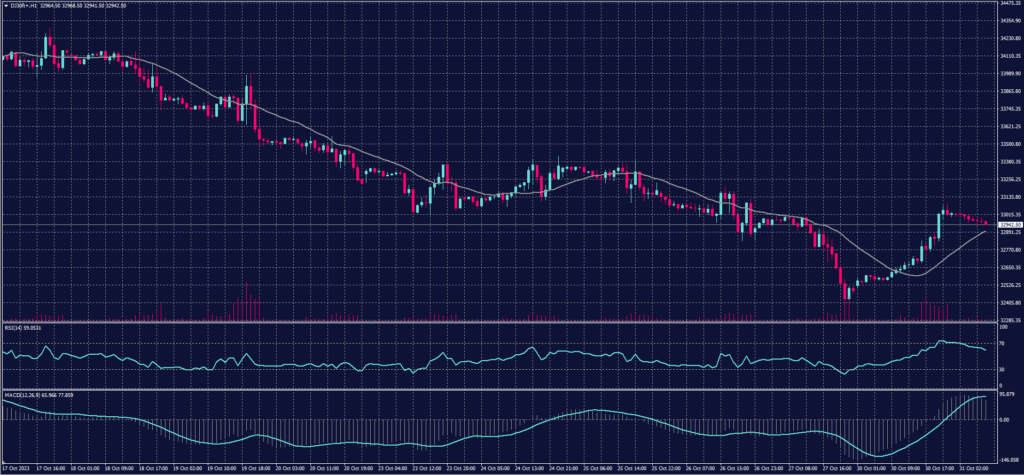
On Monday night, U.S. stock futures stabilized as investors awaited economic data throughout the week. Futures for the S&P 500 and Nasdaq 100 decreased by 0.04% and 0.03%, respectively. Futures linked to the Dow Jones Industrial Average fluctuated.
Both the Dow Jones and the S&P 500 fell by 1.7% and 2.8% in October, marking the third consecutive negative month. This represents the first three-month losing streak for both indices since March 2020. The Nasdaq Heavy Technology Index has also declined by over 3% since the beginning of the month, marking its third consecutive negative month as well.
Pivot Point: 32870
| Resistance level | Support level |
| 33240 | 32655 |
| 33455 | 32290 |
| 33820 | 32070 |
US Crude Oil (USOUSD)
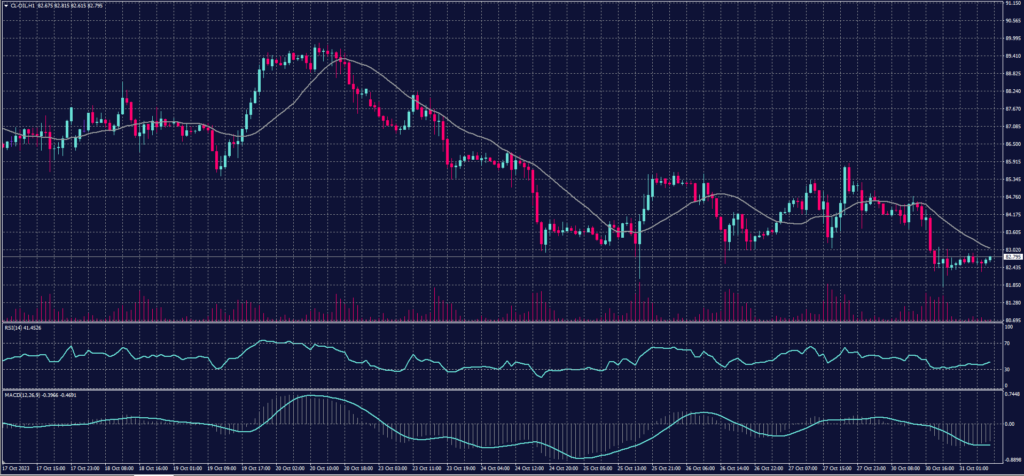
Oil prices dropped by over 3% on Monday as concerns about the impact of the Gaza conflict on supplies from the region eased and investor caution increased ahead of the Federal Reserve’s monetary policy meeting this week.
Brent crude futures settled at $87.45 per barrel, declining by $3.03, or 3.35%. Meanwhile, U.S. West Texas Intermediate crude fell by $3.23, around 3.78%, settling at $82.31 per barrel.
Pivot Point: 83.20
| Resistance level | Support level |
| 84.60 | 81.15 |
| 86.65 | 79.75 |
| 88.05 | 77.70 |
Risk Warning
This article provides real-time market analysis from contributing analysts. Please note that any views expressed in this article do not constitute operational advice. It is important to assess your risk tolerance and make independent trading decisions. STARTRADER holds no responsibility for any trading consequences that may arise from relying on the views expressed in this article.
