

U.S. Dollar Index (USDX)
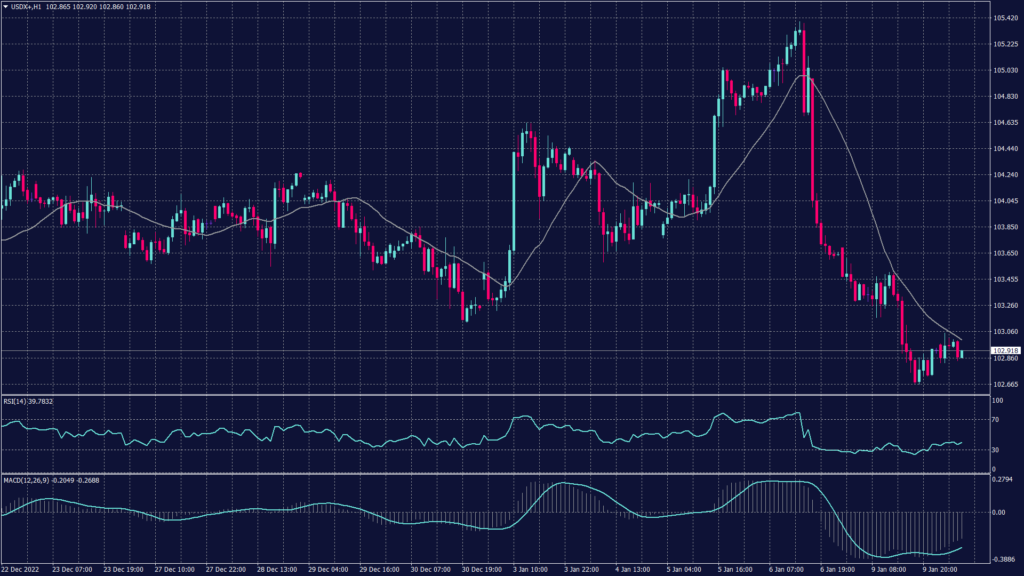
The U.S. dollar weakened as market participants expect that the Fed might end its rate-hike cycle. Meanwhile, China’s reopening drove demand for riskier assets. The U.S. dollar index edged 0.04% higher to 103.21, after tumbling 0.7% and touching a seven-month low of 102.93 in the previous session.
The dollar index trades under heavy selling pressure and remains committed to the downtrend that started in early November. Meanwhile, the hourly chart shows robust selling pressure despite the overselling readings from RSI and MACD.
Pivot Point: 102.80
| SUPPORT | RESISTANCE |
| 102.60 | 103.00 |
| 102.10 | 103.40 |
| 101.60 | 103.60 |
Euro (EURUSD)
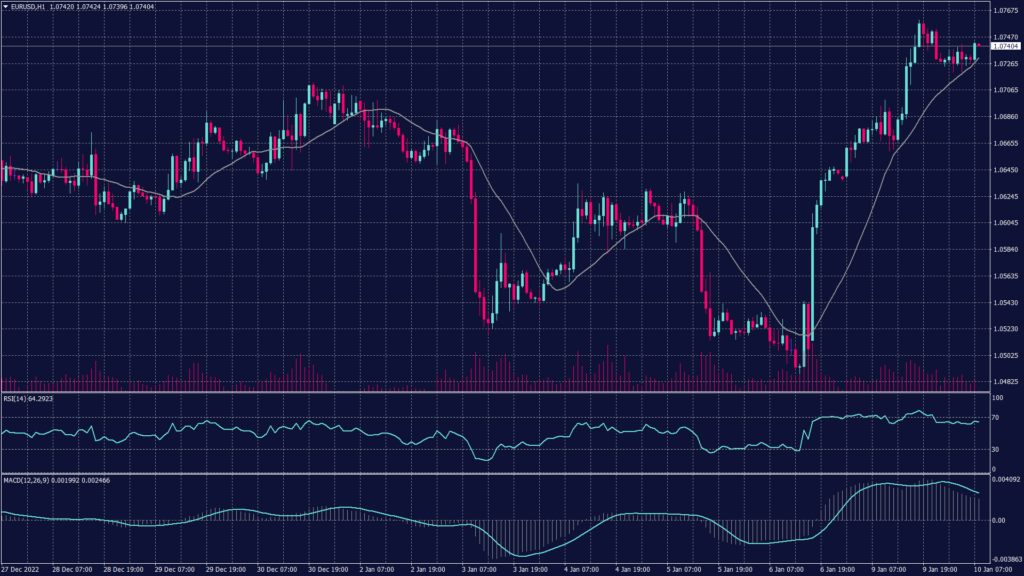
The common currency gained 0.5% to 1.0692, helped by data showing German industrial production rose 0.2% in November which is an improvement from the revised 0.4% drop seen the previous month.
The hourly chart shows slight support above 1.0720 while the buying force remains solid. However, due to the rapid rise, the chart does not show strong technical support.
Pivot Point: 1.0740
| SUPPORT | RESISTANCE |
| 1.0720 | 1.0760 |
| 1.0680 | 1.0840 |
| 1.0660 | 1.1030 |
Spot Gold (XAUUSD)
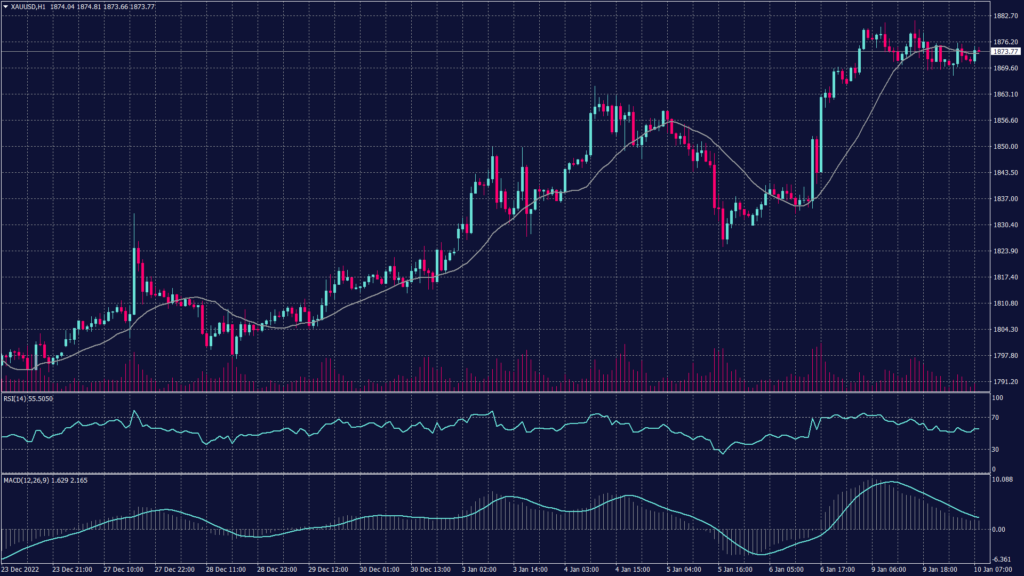
Gold prices hovered near seven-month highs on Tuesday as markets awaited more cues on U.S. monetary policy from an upcoming speech by Federal Reserve Chair Jerome Powell, as well as key inflation data. Markets expect Powell to shed more light on this trend when he speaks at a bank symposium in Sweden later in the day.
Spot gold rose 0.2% to $1,875.19 an ounce, while gold futures rose 0.1% to $1,879.30 an ounce. Bullion prices rallied over 2% in the first week of 2023.
Spot gold remains solid and hits the strong resistance at 1,880 while keeping the buying pressure at the highest levels in a few months. If gold prices broke above 1,880 it is likely to see 1,900 and 1,910. However, if gold failed to break the resistance it will most likely drop between 1,860 and 1,850.
Pivot Point: 1,875
| SUPPORT | RESISTANCE |
| 1,865 | 1,880 |
| 1,860 | 1,900 |
| 1,850 | 1,910 |
WTI Futures (CL-OIL)
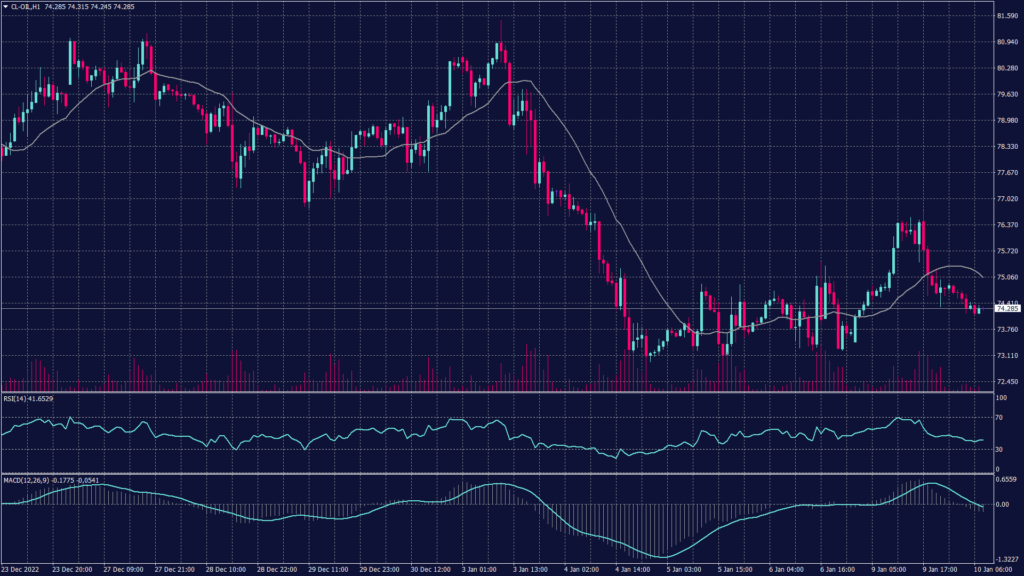
Oil prices retreated from recent gains this morning in anticipation of a speech by Federal Reserve Chair Jerome Powell, while markets also sought more clarity on the restocking of the U.S. Strategic Petroleum Reserve this year.
Brent futures fell 0.7% to $79.22 a barrel, while WTI futures dropped 0.4% to $74.30 a barrel. Markets are also watching for signals on when the U.S. plans to restock its massive SPR after the Department of Energy rejected initial bids to resupply the stockpile.
On the hourly chart, the WTI chart moves in a wide horizontal range between 73.60 and 75.00 while staying inside the declining channel on the daily chart. Technical indicators stand neutral and moving averages signal a slight advancement from the current prices to $75.
Pivot Point: 74.70
| SUPPORT | RESISTANCE |
| 74.20 | 75.00 |
| 73.60 | 76.00 |
| 73.00 | 76.20 |
