

Market News Summary
The European Stoxx 600 index recorded its largest weekly gains since March on Friday, supported by real estate stocks sensitive to interest rates, while indications of the end of monetary tightening boosted sentiment.
The Stoxx 600 index experienced a 0.2% rise, buoyed by encouraging earnings, indications of decelerating inflation, and a decline in sovereign bond yields within the Eurozone. This surge was further fuelled by growing expectations of interest rate cuts in 2024, culminating in a 3.4% increase for the index over the course of the week.
Dollar Index (USDX)
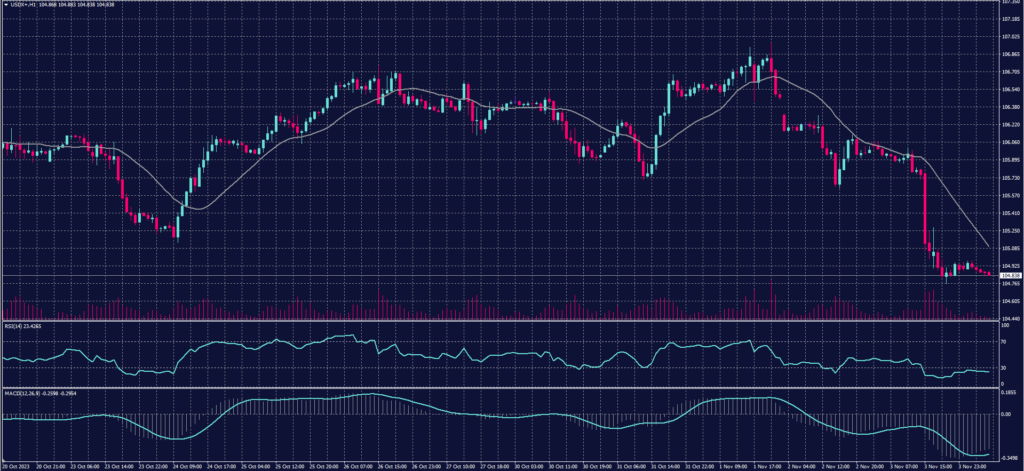
The US Labor Department announced on Friday that the economy added 150,000 jobs in October, slightly below Dow Jones’ expectations of 170,000 jobs. Additionally, Federal Reserve official Raphael Bostic stated that the sluggish employment data is a strong indicator that the current monetary tightening policy is helping to curb inflation with minor adverse effects on the economy.
At present, the dollar index is trading below its pivot point at $104.85.
Pivot Point: 105.25
| Resistance level | Support level |
| 105.70 | 104.40 |
| 106.55 | 103.90 |
| 107.00 | 103.10 |
Spot Gold (XAUUSD)
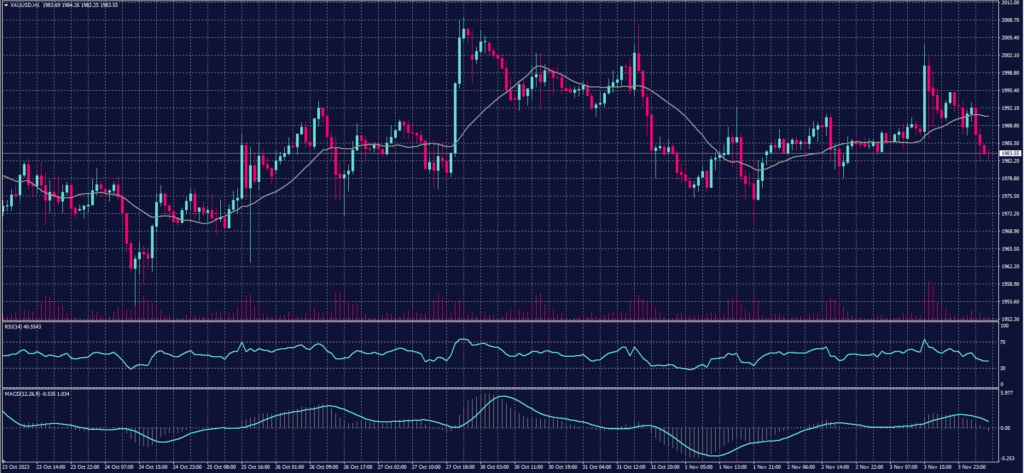
Gold recorded its first weekly loss in almost a month as the demand for the safe-haven asset slowed down. The price of gold dropped by approximately 0.8% since the beginning of the week, falling below the $2,000 level it reached last month, primarily due to escalating tensions in the Middle East.
Currently, gold is trading below its pivot point at $1983 per ounce.
Pivot Point: 1993
| Resistance level | Support level |
| 2003 | 1982 |
| 2014 | 1972 |
| 2024 | 1961 |
Dow Jones Index (DJ30ft – US30)
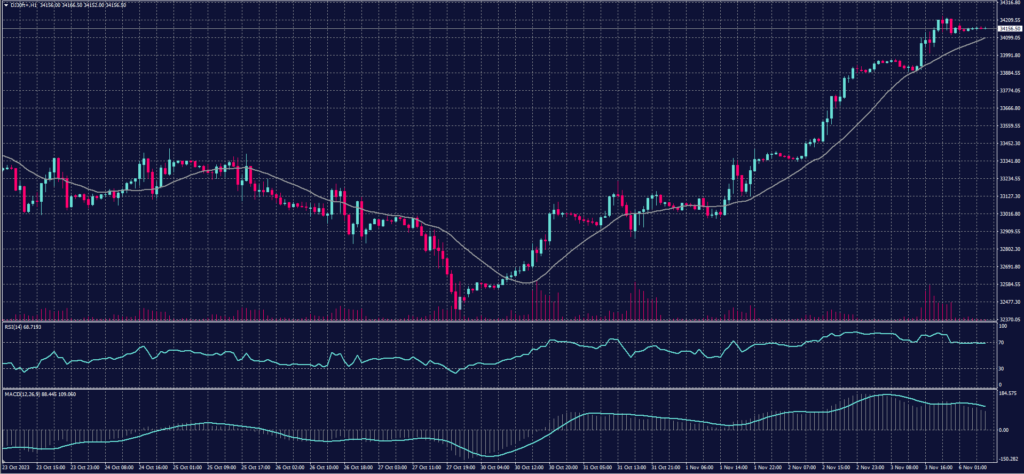
Futures for U.S. stocks saw a marginal rise at the start of this week after the major indices posted their best week of the year so far.
Futures tied to the Dow Jones Industrial Average climbed by 47 points or 0.14%. Similarly, S&P 500 futures rose by 0.15%, while Nasdaq 100 futures saw a 0.13% increase.
Pivot Point: 34090
| Resistance level | Support level |
| 34300 | 33950 |
| 34439 | 33745 |
| 34645 | 33605 |
US Crude Oil (USOUSD)
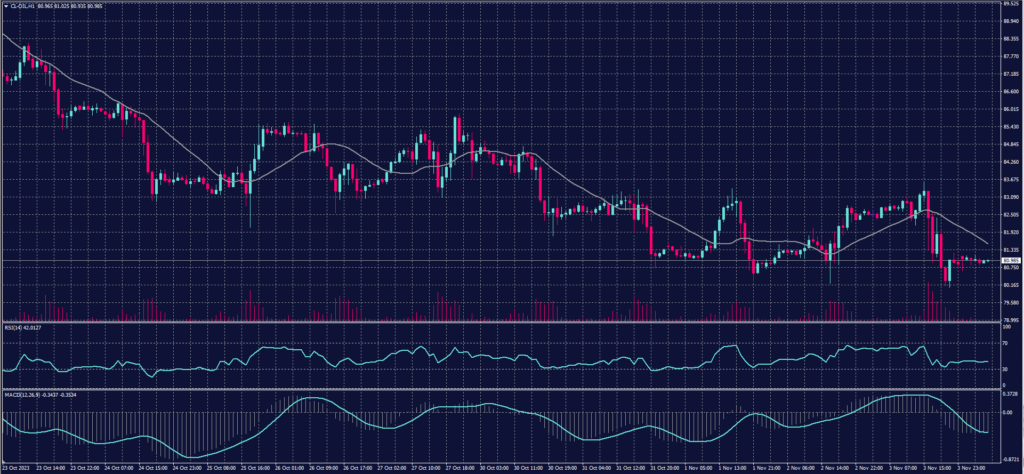
On Friday, oil prices dropped over 2% at the settlement, with concerns easing over the tensions in the Middle East. Both crude oil types ended the week with declines of more than 6%. Additionally, job data increased expectations that the Federal Reserve might have concluded its tightening cycle.
Brent crude futures fell by $1.92, equivalent to 2.3%, settling at $84.89 per barrel. Meanwhile, West Texas Intermediate (WTI) crude futures dropped by $1.95, or 2.4%, to $80.51 per barrel.
Pivot Point: 81.50
| Resistance level | Support level |
| 82.90 | 79.45 |
| 84.95 | 78.00 |
| 86.40 | 75.95 |
Risk Warning
This article provides real-time market analysis from contributing analysts. Please note that any views expressed in this article do not constitute operational advice. It is important to assess your risk tolerance and make independent trading decisions. STARTRADER holds no responsibility for any trading consequences that may arise from relying on the views expressed in this article.
