

market news summary
European stock indices posted gains on Tuesday, with investors eagerly awaiting the release of quarterly business results from Wall Street-listed companies.
The FTSE 100 index in the UK ended the session by 0.4% up, or 30 points, to 7,909 points, while the French CAC 40 rose 0.5%, or 35 points, to 7,533 points. Moreover, the German DAX rose by 0.6%, or 93 points, to 15,882 points. The Stoxx 600 also rose by 0.4%, or 1.8 points, to 468 points.
Meanwhile, China’s gross domestic product grew by 4.5% in the first quarter, surpassing expectations of a 4% growth rate.
This positive news has been supported by policymakers’ efforts to boost economic growth in China, following the lifting of strict Covid-19 related restrictions in December.
Dollar index (USDX)
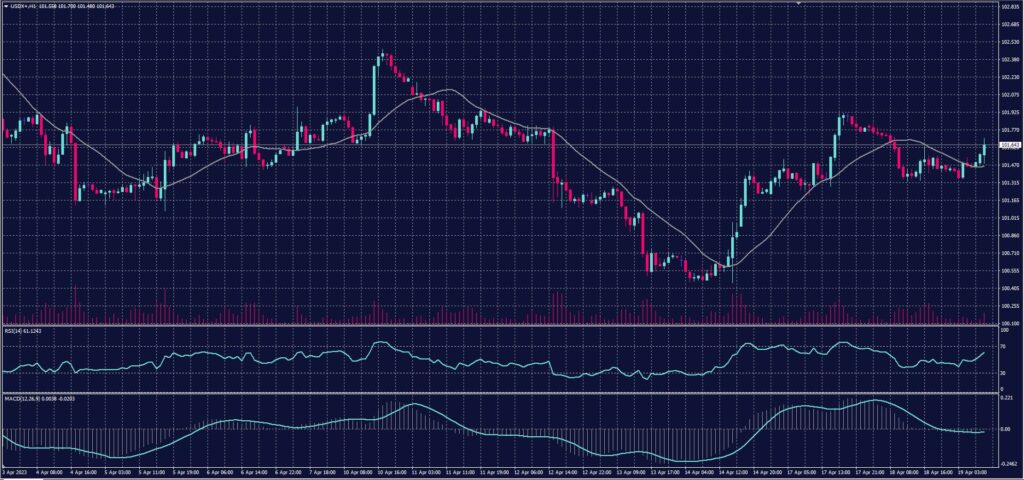
In early European trade on Tuesday, the US dollar fell, reversing some of its overnight gains, as investors’ risk appetite improved following healthy growth data from China.
Despite the initial decline, the dollar index rebounded on Wednesday, rising by 0.1% in trading and settling near its pivot point.
Pivot Point: 101.50
| Resistance level | Support level |
| 101.72 | 101.20 |
| 102.00 | 101.00 |
| 102.54 | 100.55 |
Spot Gold (XAUUSD)
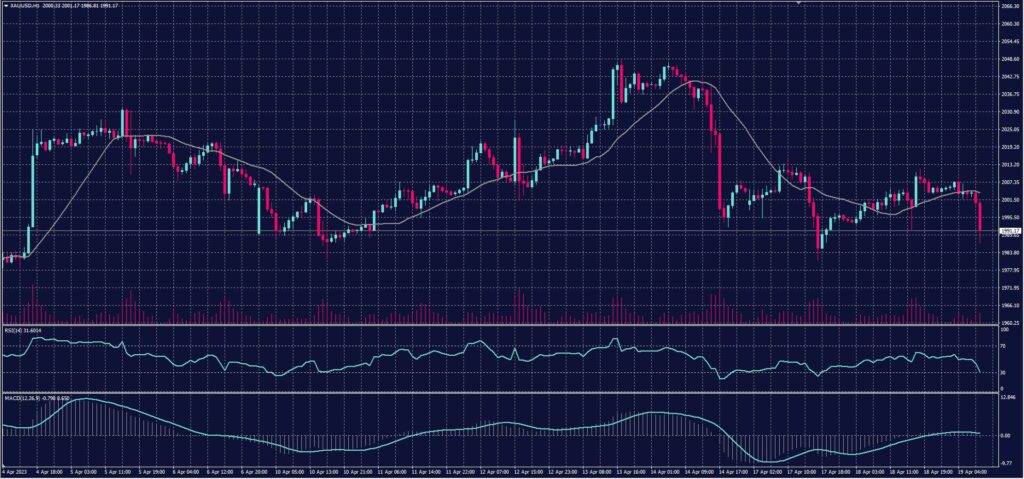
Spot gold prices declined 0.1% to $2,003.03 per ounce, while US gold futures fell 0.2% to $2,016.20.
The dollar index rose 0.1 percent, making the yellow metal more expensive for buyers of other currencies.
Pivot Point: 2002
| Resistance level | Support level |
| 2014 | 1993 |
| 2023 | 1982 |
| 2043 | 1962 |
Dow Jones Index (DJ30ft – US30)
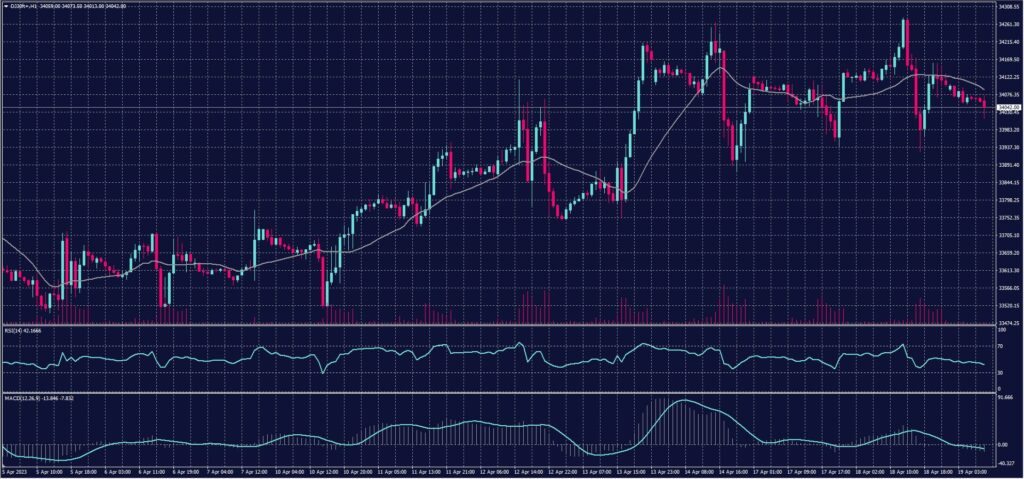
The Dow Jones fell 0.03%, or about 10 points, in Tuesday’s session. Furthermore, Johnson & Johnson shares fell after the healthcare group warned investors of the continuing impact of inflation-driven costs this year.
Goldman Sachs shares declined as earnings dropped 19%, due to a decrease in deal-making and bond trading activities.
Pivot Point: 34100
| Resistance level | Support level |
| 34270 | 33925 |
| 34455 | 33755 |
| 34800 | 33395 |
US Crude (USOUSD)
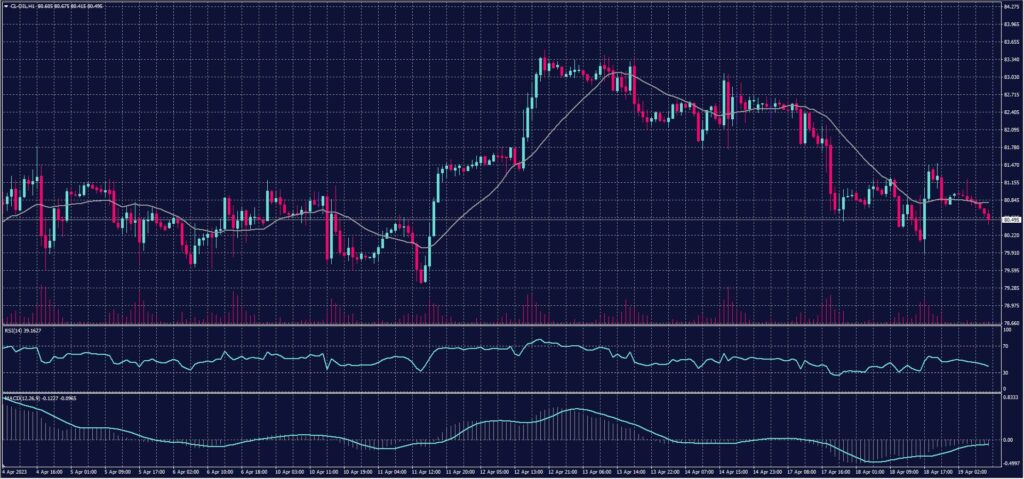
On Wednesday, April 19th, oil prices increased in early Asian trading following strong economic data from China and predictions of a decline in US crude inventories.
Brent crude futures rose 7 cents a barrel to 84.84 dollars, and US West Texas Intermediate crude rose 3 cents to 80.89 dollars a barrel.
Pivot Point: 80.75
| Resistance level | Support level |
| 81.65 | 80.05 |
| 82.35 | 79.10 |
| 83.90 | 77.50 |
