

U.S. Dollar Index (USDX)
The dollar held close to an eight-month low against its peers on Thursday, as a gloomy U.S. corporate earnings season stoked recession fears and as traders stayed on guard ahead of a slew of central bank meetings next week.
Downbeat earnings and guidance from U.S. companies and a string of tech sector layoffs have deepened fears of a sharp economic downturn in the United States, leading investors to pare back expectations on how much longer the Federal Reserve will need to aggressively raise interest rates.
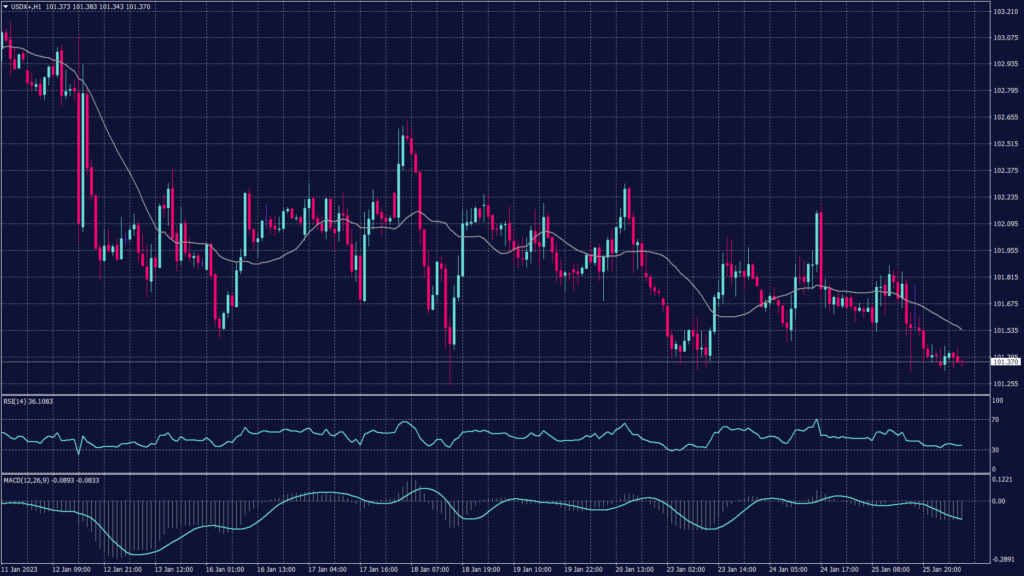
The U.S. dollar index inched 0.1% higher to 101.65, after falling as low as 101.52 earlier in the session, testing last week’s eight-month trough of 101.51.
The dollar index trades under heavy selling pressure and remains committed to the downtrend that started in early November. Meanwhile, technical indicators show a possibility of a further decline below 101.40.
Pivot Point: 101.40
| SUPPORT | RESISTANCE |
| 101.25 | 101.50 |
| 101.10 | 101.60 |
| 100.75 | 101.80 |
Euro (EURUSD)
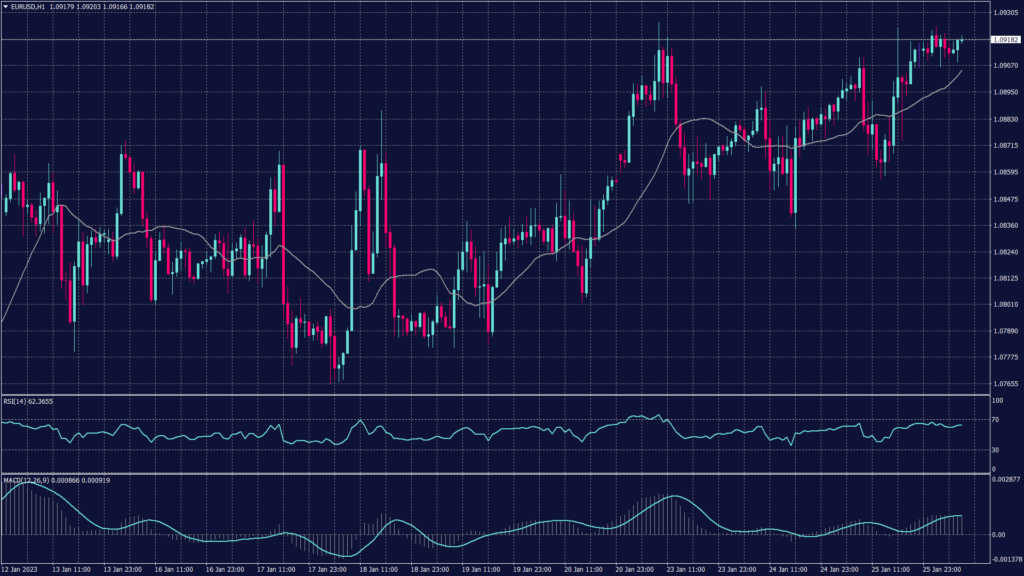
markets expect policymakers at the Bank of England and European Central Bank (ECB), which will also meet next week, to deliver 50 bps rate hikes. The ECB is seen most likely to remain hawkish. The euro slipped 0.03% to $1.0911, though remained close to its nine-month high of $1.0927 hit on Monday.
Technically, the fiber pair remains on the accelerating side on both hourly and daily charts. Meanwhile, the pair has built its support above 1.0870 and 1.0900 which depleted the selling pressure. Technical indicators remain on the rise and signal a high probability of further gains.
Pivot Point: 1.0920
| SUPPORT | RESISTANCE |
| 1.0900 | 1.0990 |
| 1.0870 | 1.1050 |
| 1.0840 | 1.1110 |
Spot Gold (XAUUSD)
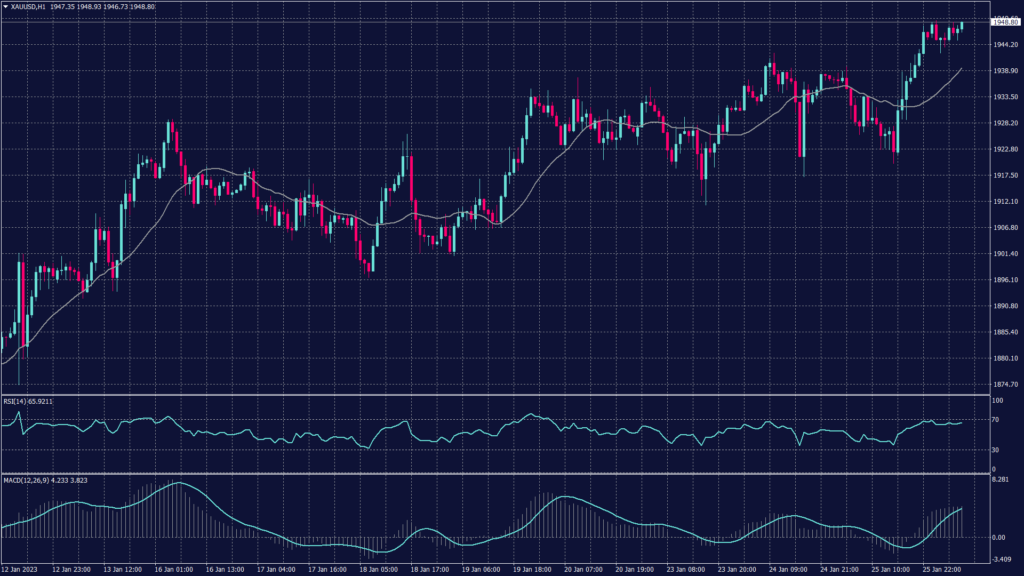
Gold prices touched a nine-month high, with spot gold at $1,945.55 per ounce, after hitting $1,949.09 earlier in the day. The precious metal buying has increased as investors are seeking safety from the expected recession.
Gold remains within the horizontal range between 1,920 and 1,940 on the daily chart, indicating neutral trend pressure. However, the hourly chart shows a higher probability of fluctuations between 1,930 and 1,940. The intraday fluctuations will open a chance for speculative gains.
Pivot Point: 1,940
| SUPPORT | RESISTANCE |
| 1,930 | 1,943 |
| 1,927 | 1,945 |
| 1,921 | 1,950 |
WTI Futures (CL-OIL)
Oil prices were steady on Thursday after U.S. crude stocks climbed less than expected, while investors awaited further clarity on supply drivers, including an OPEC+ meeting and the looming EU ban on Russian refined products.
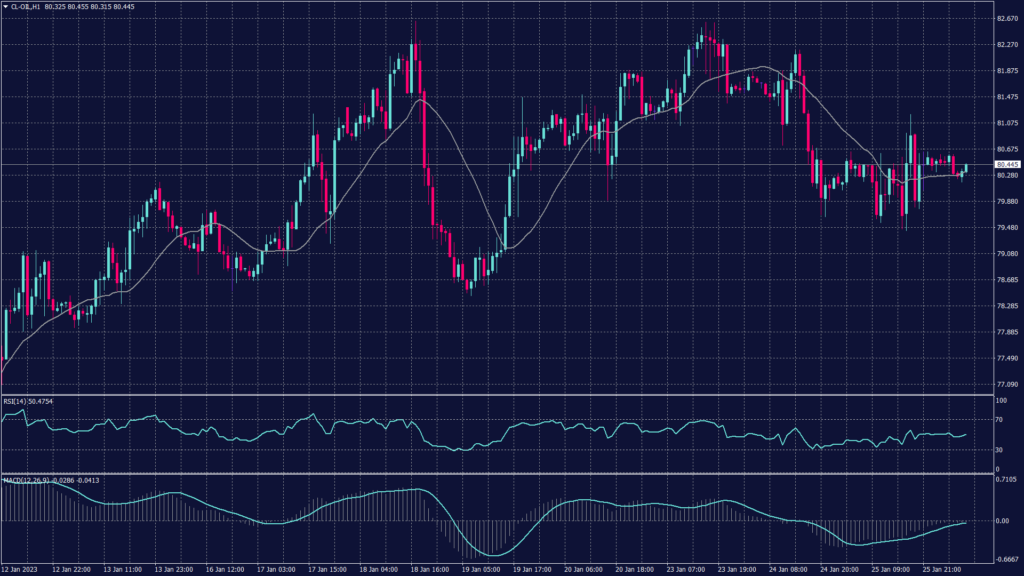
Brent futures dipped 0.1% to $86.08 per barrel, while WTI futures rose 18 cents, or 0.2%, to $80.33. Oil prices were also little changed after data showed a build in U.S. crude inventories which was less than expected.
Crude inventories edged higher by 533,000 barrels to 448.5 million barrels in the week ending Jan. 20, the Energy Information Administration (EIA) said. Meanwhile, OPEC+ is likely to endorse the group’s current output levels at a February 1 meeting.
Technically, crude oil is trading under bearish pressure that is accumulating above the $80 mark. The chart is expected to show further decline as the hourly chart shows slowing buying pressure. The technical indicators show divergence and a tendency for further decline.
Pivot Point: 80.40
| SUPPORT | RESISTANCE |
| 79.65 | 81.70 |
| 79.10 | 82.60 |
| 78.45 | 83.50 |
