

U.S. Dollar Index (USDX)
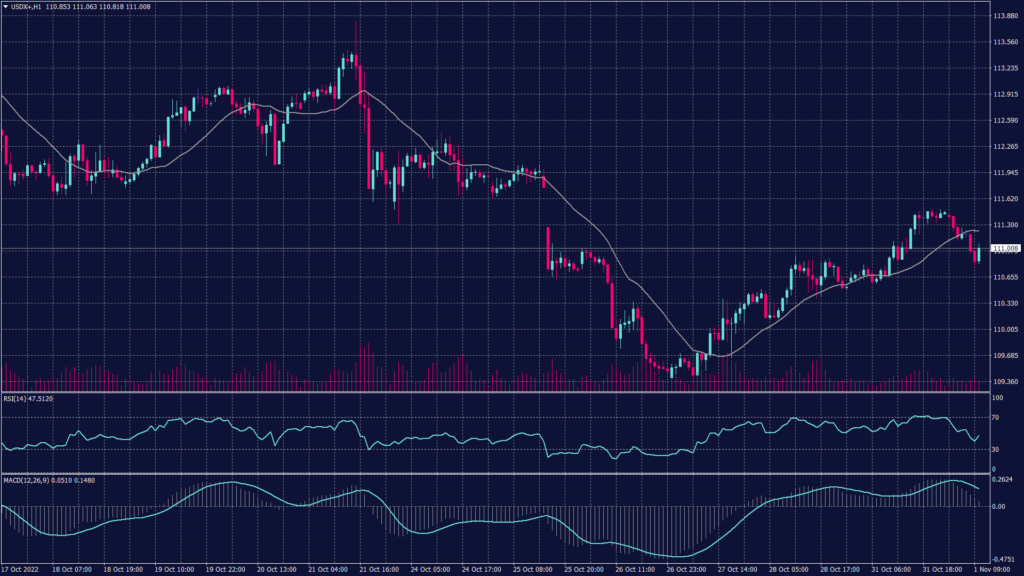
The U.S. dollar eased from a one-week top against a basket of major peers on Tuesday, as traders weighed the odds of a less aggressive Federal Reserve at Wednesday’s widely watched monetary policy meeting.
The U.S. dollar index eased 0.16% to 111.35, eating into some of the 0.79% gains it made on Monday. The index has fluctuated widely around the 112 level since it retreated from a two-decade high of 114.78 at the end of September.
Pivot Point: 110.70
| SUPPORT | RESISTANCE |
| 110.30 | 111.10 |
| 110.10 | 111.60 |
| 109.70 | 112.72 |
Euro (EURUSD)
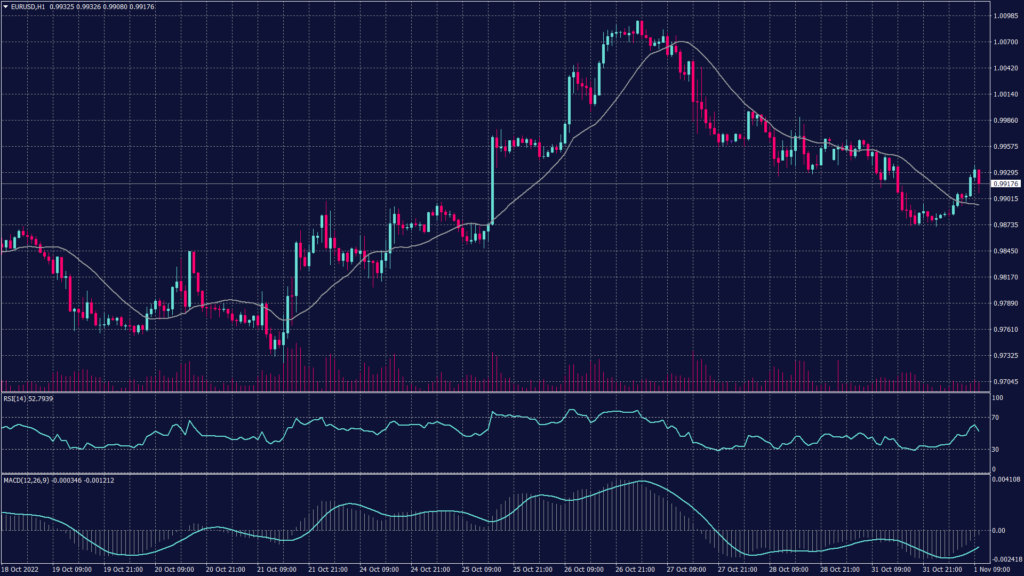
Pressure remained on the European Central Bank to continue with aggressive rate hikes after data on Monday showed euro zone inflation came in hotter than expected at 10.7%, a new record. The ECB next decides on rates on December 15.
Pivot Point: 0.9940
| SUPPORT | RESISTANCE |
| 0.9920 | 0.9960 |
| 0.9870 | 0.9990 |
| 0.9830 | 1.0015 |
Spot Gold (XAUUSD)
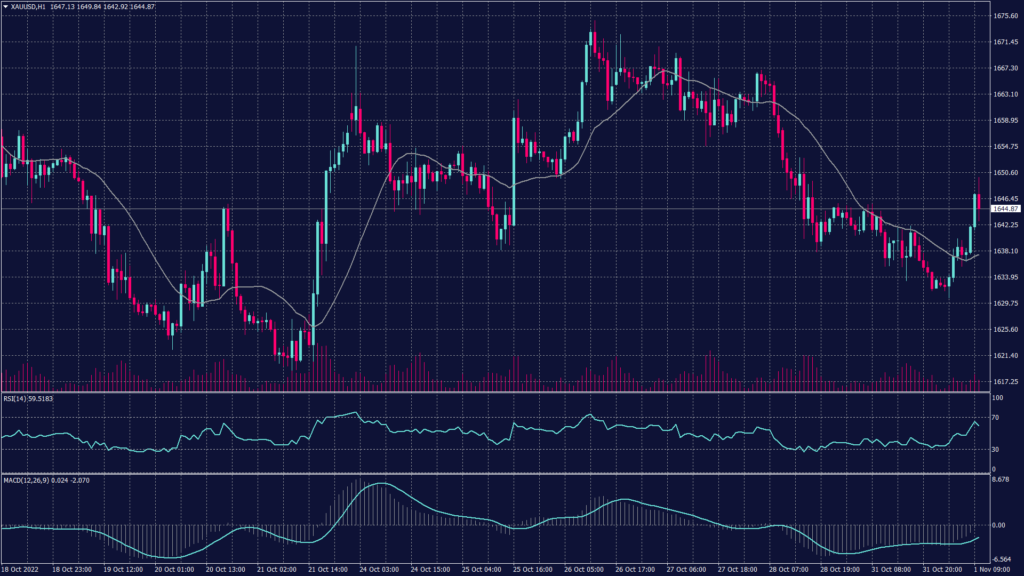
Gold prices hit a 10-day low on Tuesday, with broader metal markets losing more ground as the dollar rebounded ahead of a widely expected Federal Reserve interest rate hike.
Spot gold fell 0.1% to $1,631.70 an ounce, while gold futures fell 0.4% to $1,634.75 an ounce. Both instruments were trading at a 10-day low, after tumbling for a seventh straight month in October.
Bullion prices are set to lose more ground as caution kicks in ahead of a Federal Reserve meeting that is set to conclude on Wednesday. The central bank is widely expected to hike interest rates by 75 basis points (bps).
Technically, spot gold remains negative on the daily chart and targets $1,620 per ounce with little to no support before that level. Technical indicators show a probability of a horizontal movement or neutral momentum. Meanwhile, the hourly chart shows a continuation in a slow fashion to the downtrend.
Pivot Point: 1,635
| SUPPORT | RESISTANCE |
| 1,630 | 1,639 |
| 1,624 | 1,643 |
| 1,620 | 1,650 |
West Texas Crude (USOUSD)
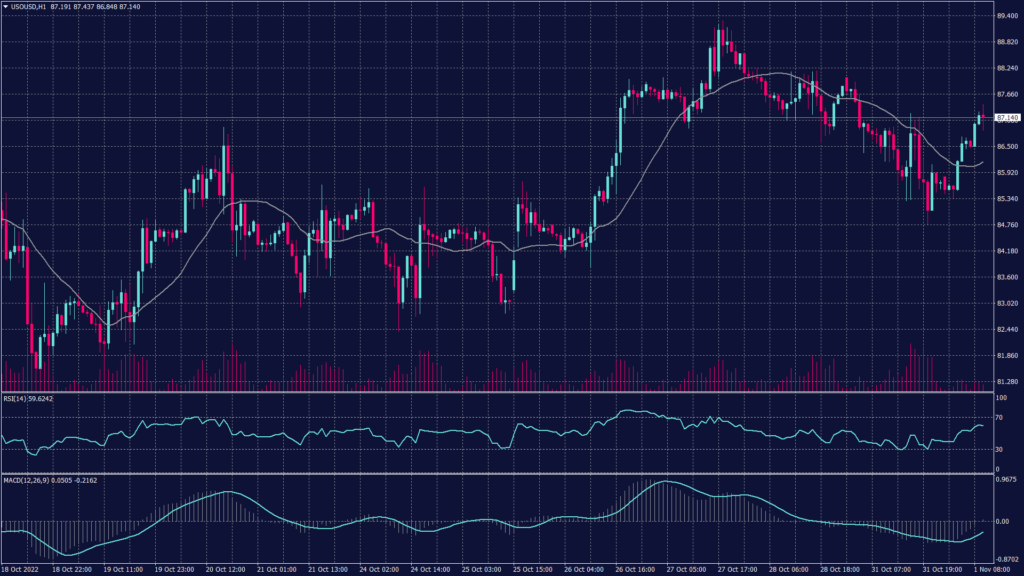
Oil prices rose on Tuesday, paring losses from the previous session, as a weaker U.S. dollar offset widening COVID-19 curbs in China that have stoked fears of slowing fuel demand in the world’s second-largest oil consumer.
Brent crude for January delivery rose 0.8% to $93.54 a barrel. WTI crude rose 0.7% to $87.11 a barrel. Both benchmarks ended October higher, their first monthly gains since May after the OPEC+ said they would cut output by 2 million barrels per day (bpd).
Pivot Point: 86.20
| SUPPORT | RESISTANCE |
| 85.50 | 87.95 |
| 84.90 | 88.70 |
| 84.30 | 89.95 |
