

Oil futures edged slightly higher on Wednesday on hopes for improved Chinese demand while uncertainty about how a Western cap on Russian oil prices would play out kept markets on edge after a sharp fall the previous session.
The Fed is set to meet next week in its final meeting for the year. While the bank is expected to hike interest rates by a relatively smaller margin, it has warned that its benchmark rate could rise to higher-than-expected levels next year.
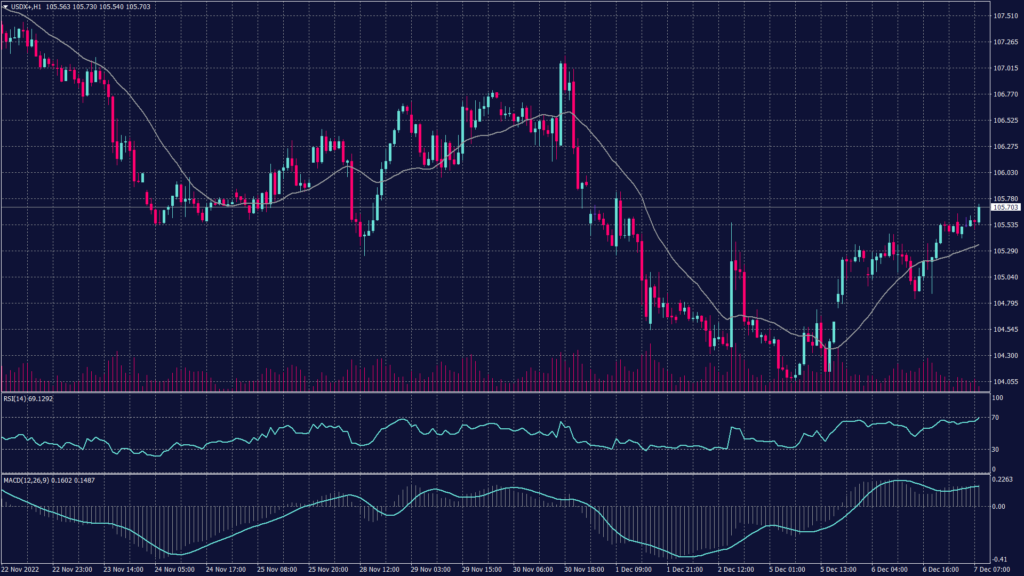
U.S. Dollar Index (USDX)
The U.S. producer price index for November will be under the microscope on Friday for updates about the inflation in the country. Given that the Fed signaled that interest rates will track inflation, markets grew more cautious ahead of the reading.
Additionally, the Fed will be meeting next week for its final meeting for this year. While it is expected to hike interest rates by a relatively smaller margin than the previous meetings, it has warned that its benchmark rate could rise to higher-than-expected levels next year.
On the hourly chart the report returns between the major levels of 105.25 and 106.30. Price action shows a possible continuation to the uptrend under the condition of closing the day at or above 105.90. However, technical indicators show a start of selling pressure on the hourly chart.
On the daily chart, the overall trend remains negative and targeting the support at 104.40. However, the technical indicators show fluctuations with a heavier selling pressure build up.
Pivot Point: 105.70
| SUPPORT | RESISTANCE |
| 105.25 | 105.90 |
| 104.80 | 106.30 |
| 104.40 | 106.70 |
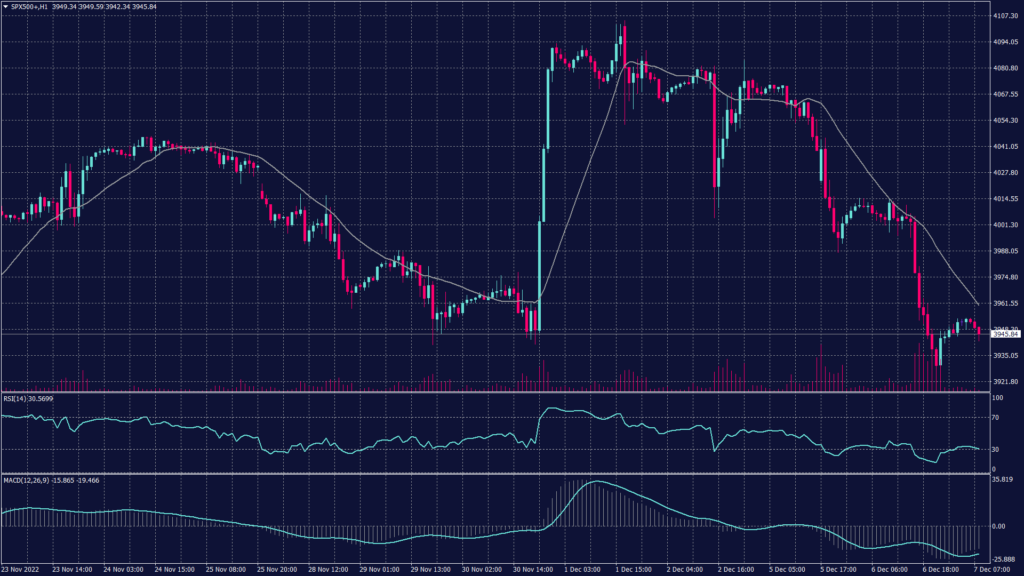
S&P 500 (SPX500+)
Wall Street ended lower on Tuesday, with the S&P 500 extending its losing streak to four sessions, as skittish investors fretted over Federal Reserve rate hikes and further talk of a looming recession.
The Dow Jones Industrial Average fell 350.76 points, or 1.03%, to close at 33,596.34, the S&P 500 lost 57.58 points, or 1.44%, to finish at 3,941.26 and the Nasdaq Composite dropped 225.05 points, or 2%, to end on 11,014.89.
The hourly chart shows a continuation to the downtrend while technical indicators readings are indecisive. However, the daily chart shows a possible decline towards 3,800.
Pivot Point: 3,950
| SUPPORT | RESISTANCE |
| 3,920 | 4,000 |
| 3,900 | 4,060 |
| 3,800 | 4,100 |
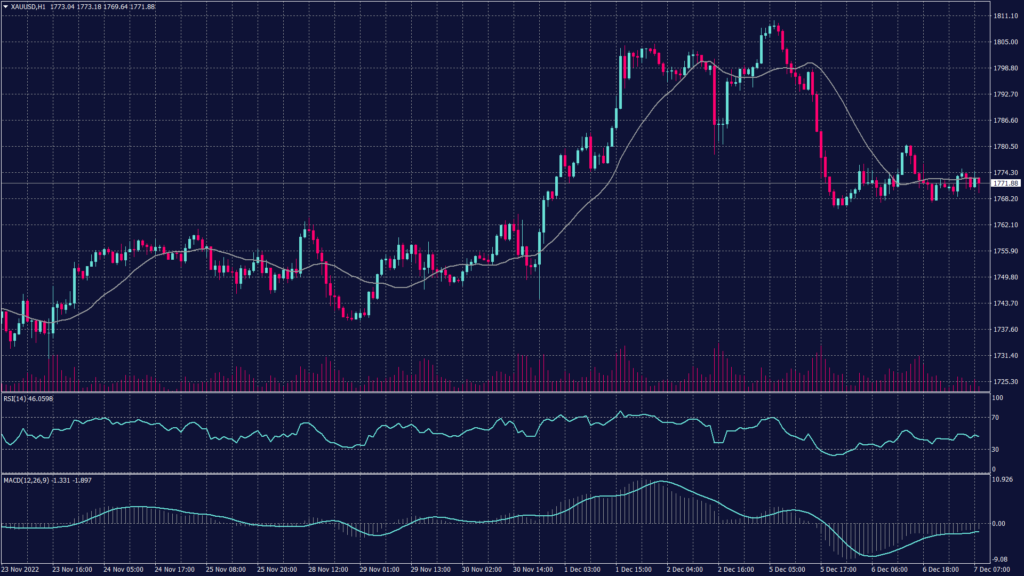
Spot Gold (XAUUSD)
Gold prices remained below the major levels during the Asian session as investors await more clues on the global economy this week. Meanwhile, Spot gold traded around $1,770.33 an ounce, while gold futures fell 0.1% to $1,782.35 an ounce. Both instruments are trading down this week, as stronger-than-expected U.S. data pushed up fears of inflation remaining sticky in the country.
The 4 hours and the daily chart show a high probability of continuing the uptrend despite the readings of the technical indicators. However, RSI and MACD show a probability of a slight drop to $1,765 per ounce.
Pivot Point: $1,770
| SUPPORT | RESISTANCE |
| 1,765 | 1,785 |
| 1,760 | 1,790 |
| 1,755 | 1,795 |
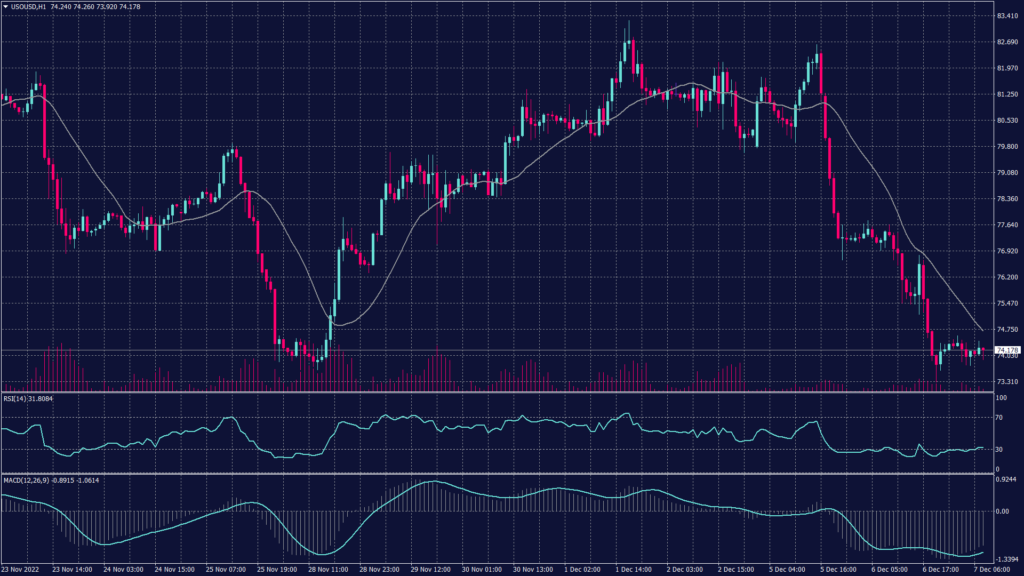
West Texas Crude (USOUSD)
Oil hovered near a one-year low on Wednesday as increasing concerns over U.S. economic health and the expectations for a bigger-than-expected draw in crude inventories. However, Brent oil futures fell 0.3% to $79.51 a barrel, while West Texas Intermediate crude futures shed 0.1% to $74.16 a barrel during the early Asian trades.
WTI remains under selling pressure despite the speculative readings of the technical indicators. However, the movement of the WTI is more reliant on the fundamental news as technical readings are vague.
Pivot Point: 74.00
| SUPPORT | RESISTANCE |
| 73.30 | 76.10 |
| 72.00 | 77.40 |
| 71.10 | 75.60 |
