

U.S. Dollar Index (USDX)
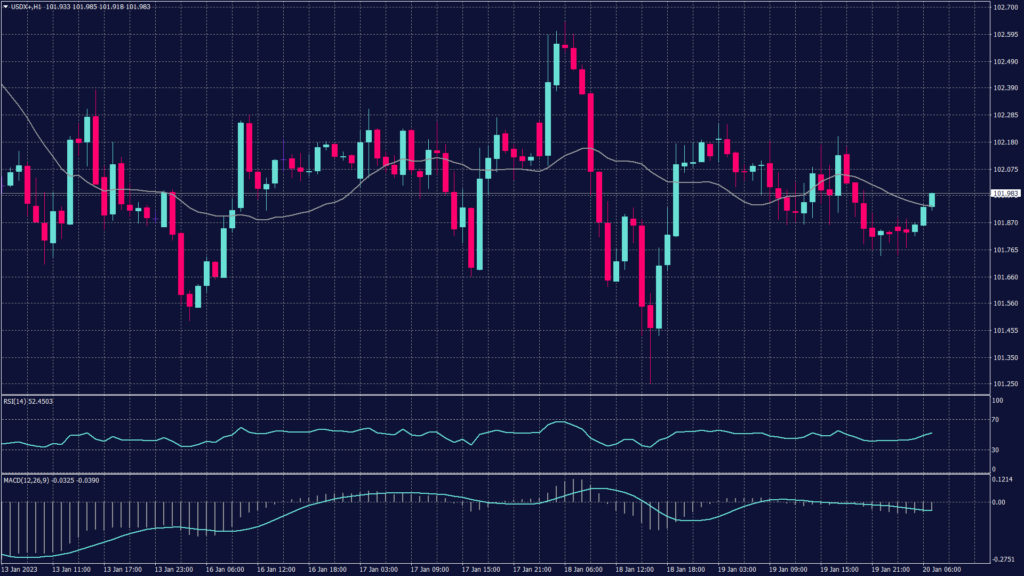
The U.S. dollar traded horizontally this morning as fears of an economic slowdown dented risk sentiment. Meanwhile, the dollar index rose 0.069% to 102.090, not far off the seven-month low of 101.51 it touched on Wednesday.
The number of Americans filing new claims for unemployment benefits unexpectedly fell last week, pointing to another month of solid job growth and continued labor market tightness.
Investor focus will switch to the upcoming Fed meeting at the start of next month. The central bank raised interest rates by 50 basis points in December after four straight 75 basis point hikes and the market is eagerly anticipating another step-down.
The dollar index trades under heavy selling pressure and remains committed to the downtrend that started in early November. Meanwhile, technical indicators show a neutral trend and move in a horizontal fashion.
Pivot Point: 101.90
| SUPPORT | RESISTANCE |
| 101.70 | 102.40 |
| 101.40 | 102.80 |
| 101.00 | 103.10 |
Japanese Yen (USDJPY)
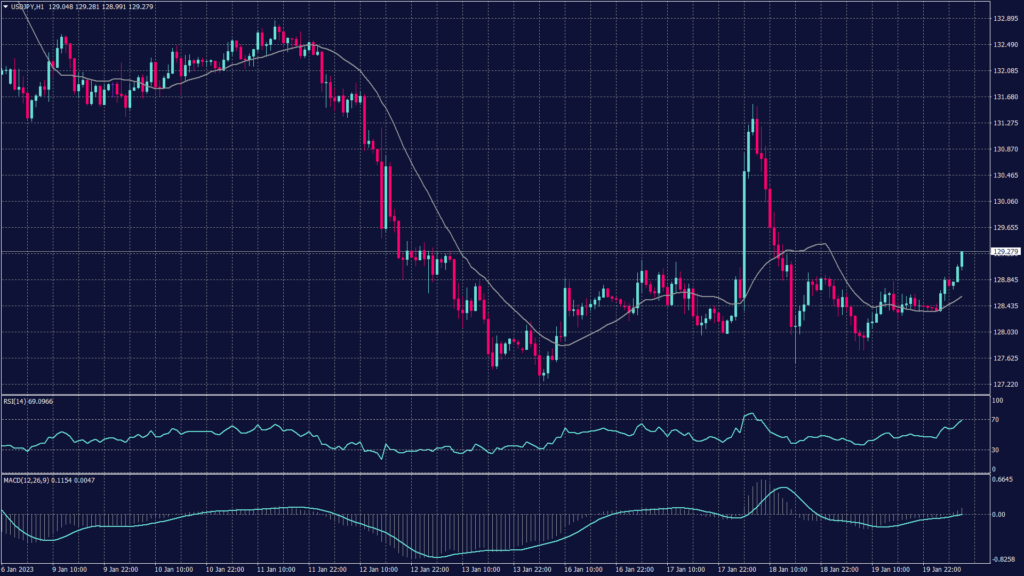
The Japanese yen weakened 0.32% to stand at 128.86 as speculation continues to swirl that the Bank of Japan will eventually move away from its ultra-easy policy.
Data on Friday showed Japan’s core consumer prices in December rose 4.0% from a year earlier, double the central bank’s 2% target, with the latest figure likely to fuel market expectations that the Bank of Japan (BOJ) will soon end its yield control policy and allow interest rates to rise more.
Technically, the pair remains supported above 128.60 on the hourly chart while remaining committed to the declining channel on the daily chart. In case of breaking below 128.60, it will most likely head towards 125.60.
Pivot Point: 129.15
| SUPPORT | RESISTANCE |
| 128.60 | 129.90 |
| 127.90 | 130.25 |
| 127.20 | 130.90 |
Spot Gold (XAUUSD)
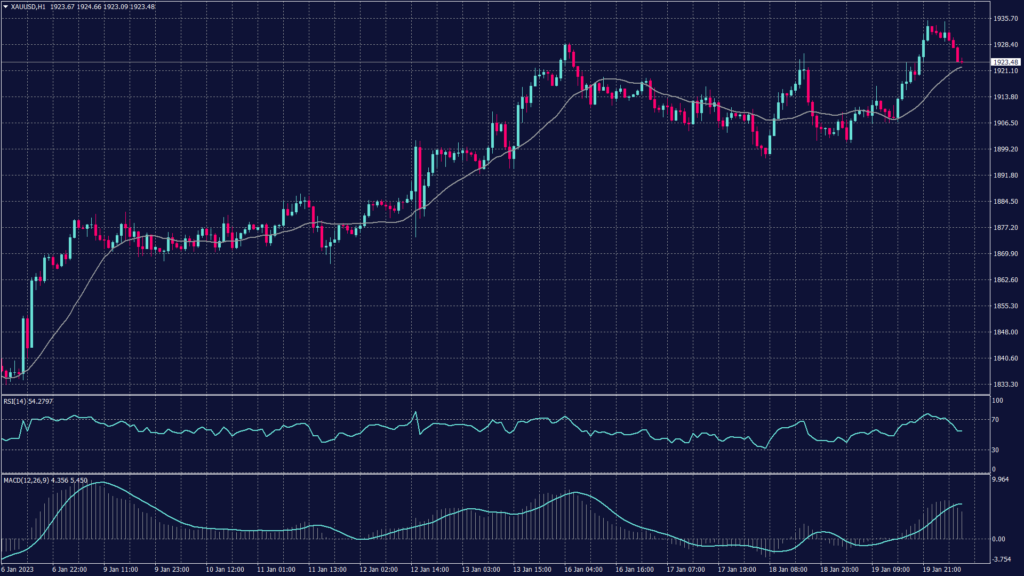
Gold prices hovered at a nine-month high this morning and were heading for a fifth consecutive week of gains. Spot gold fell 0.1% to $1,930.90 an ounce, while gold futures steadied around $1,932.35 an ounce.
Hawkish comments from the Federal Reserve also weighed on sentiment. Fed Vice Chair Lael Brainard said on Thursday that interest rates will need to remain high despite signs of easing inflation, given that price pressures are still trending close to 40-year highs.
The daily chart shows a high possibility of breaking above 1,930. However, technical indicators show a slowing buying pressure below 1,930 on the daily chart. Meanwhile, the hourly chart shows fluctuations and high volatility between 1,920 and 1,930.
Pivot Point: 1,927
| SUPPORT | RESISTANCE |
| 1,920 | 1,930 |
| 1,912 | 1,935 |
| 1,905 | 1,940 |
WTI Futures (CL-OIL)
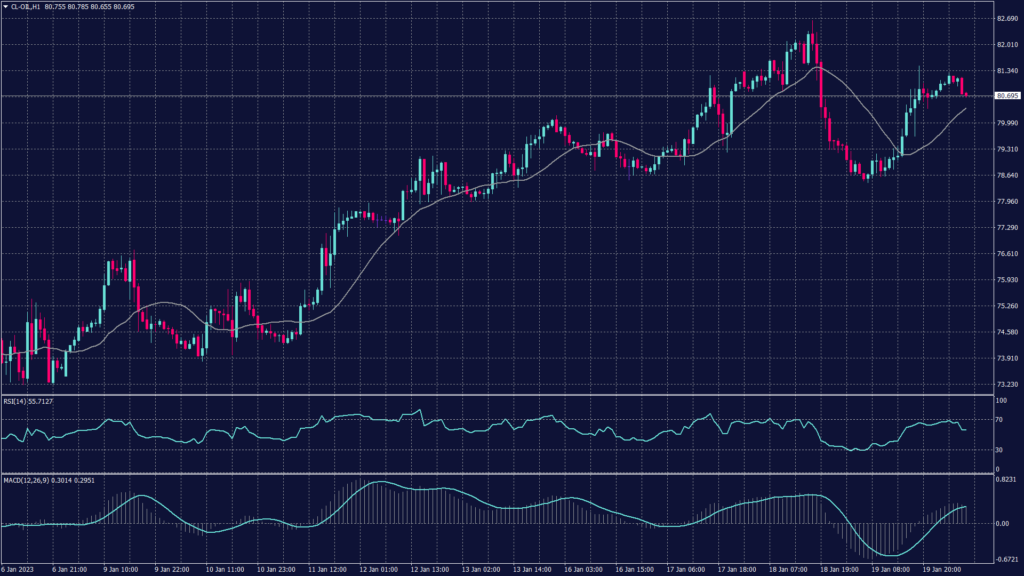
Oil prices rose further on Friday and were set to end the week higher as optimism over an eventual recovery in Chinese demand this year largely offset fears that a global economic slowdown will dent crude markets.
Markets are betting on a strong boost to the Chinese economy from the week-long Lunar New Year holiday, particularly after the country relaxed almost all anti-COVID restrictions earlier this month.
Brent oil futures rose 0.3% to $86.53 a barrel, while West Texas Intermediate crude futures rose 0.6% to $81.08 a barrel. Both contracts were up for a second consecutive session and were set to gain up to 1.7% this week.
Pivot Point: 81.00
| SUPPORT | RESISTANCE |
| 80.10 | 81.70 |
| 79.40 | 82.60 |
| 78.45 | 83.50 |
