

market news summary
Goldman Sachs has reduced the likelihood of a US economic recession over the next 12 months by about 5% to 20%. In a memo, Goldman stated, “Recent data has increased our confidence that reducing inflation to acceptable levels will not require a recession.”
European indices ended the first session of the week in decline following the release of Chinese economic data, while shares of Dutch pharmaceutical company Argenx jumped by about 31%.
At the end of the session, the STOXX600 index declined by about 0.63% to 457 points, the French CAC dropped by 1.12% to reach 7,291 points, and the German DAX fell by about 0.23% to 16,068 points. The UK’s FTSE also closed down by about 0.38%, reaching 7,406 points.
Dollar Index (USDX)
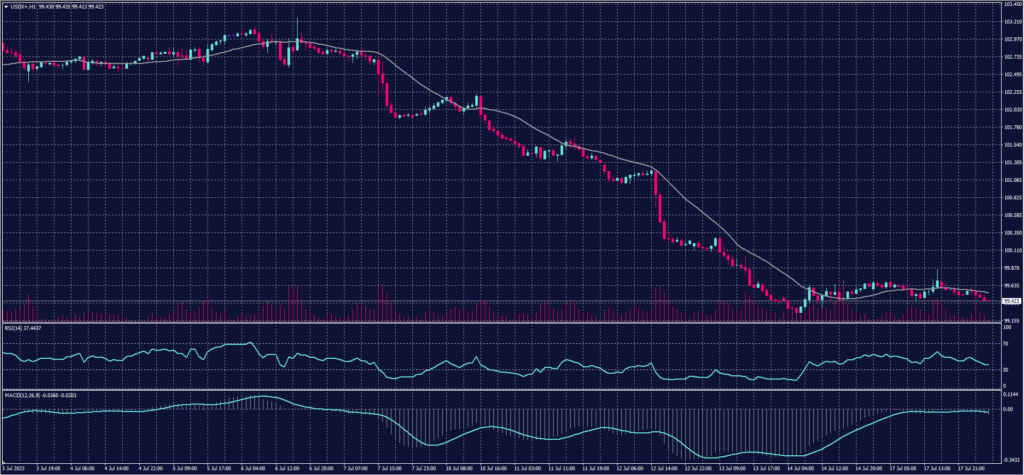
The US dollar declined in the early European hours, continuing its worst weekly drop of the year, while weak Chinese growth data weighed on the yuan.
The dollar index was traded lower at 99.42, following an 11% decline last week, marking its largest weekly drop since November.
Pivot point: 99.60
| Resistance level | Support level |
| 99.80 | 99.30 |
| 100.05 | 99.15 |
| 100.20 | 98.90 |
Spot Gold (XAUUSD)
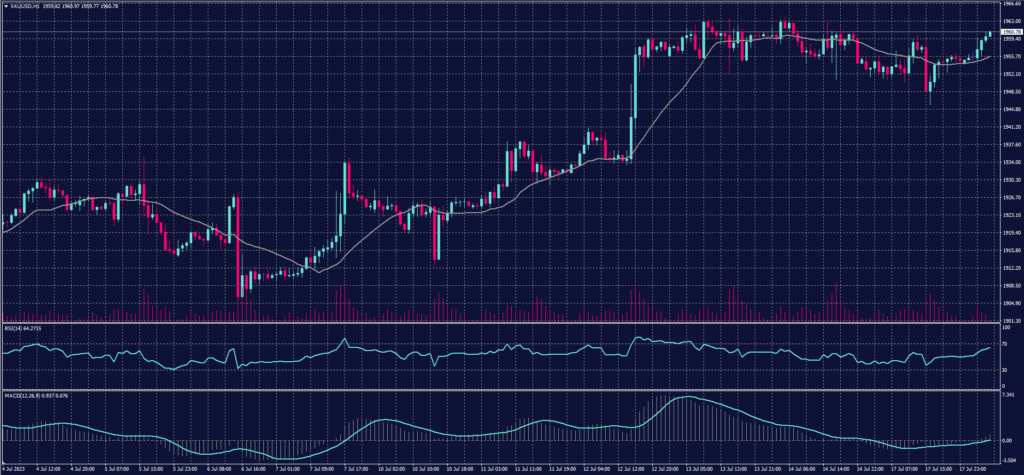
Gold prices marginally declined at the close of trading on Monday, July 17, following their biggest weekly gain since last April. This came after disappointing data from China, where the country’s GDP grew at a lower-than-expected rate of 6.3% in the second quarter of the year, below the anticipated reading of 7.3%.
At the settlement, gold futures dropped by approximately 0.4% to $1,956 per ounce.
Pivot point: 1953
| Resistance level | Support level |
| 1961 | 1947 |
| 1967 | 1939 |
| 1975 | 1932 |
Dow Jones Index (DJ30ft – US30)
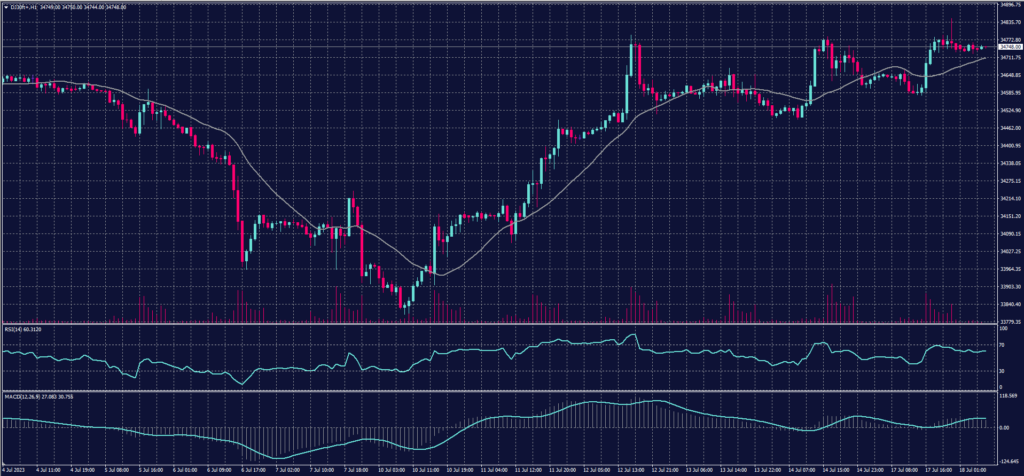
US indices closed with collective gains in Monday’s session, supported by bank and technology stocks as investors remained optimistic about the second-quarter earnings results of companies in 2023. Tesla and Netflix are expected to announce their earnings this week, along with other major banks such as Bank of America, Morgan Stanley, and Goldman Sachs.
The Dow Jones index rose by 0.22%, equivalent to approximately 76 points, achieving its sixth consecutive daily gain and its highest close in nearly 8 months.
Pivot point: 34,720
| Resistance level | Support level |
| 34865 | 34595 |
| 34990 | 34450 |
| 35135 | 34325 |
US Crude (USOUSD)
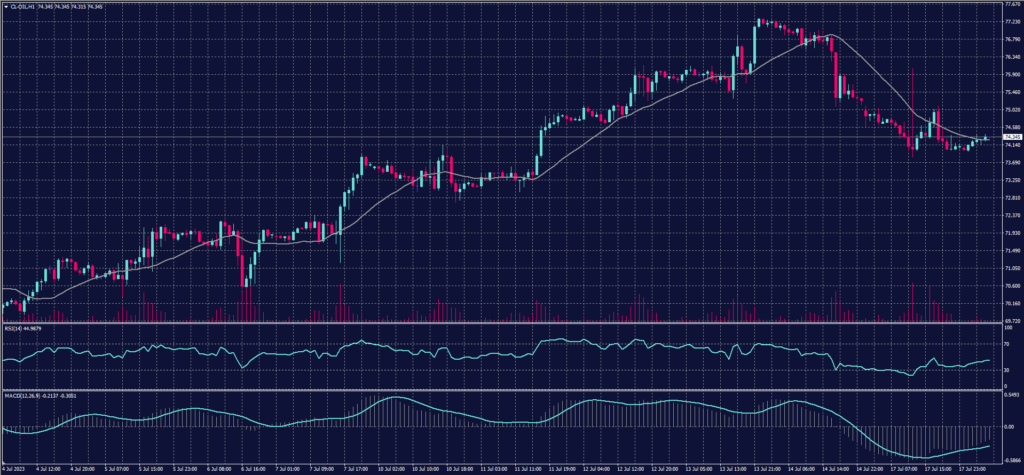
Oil prices declined at the close of trading on Monday, July 17, amid concerns over slowing global demand for crude oil following negative data from China. The Russian Ministry of Energy also announced today that Moscow would reduce its oil exports by around 2.1 million tons during the third quarter.
At the settlement, Brent crude futures fell by approximately 1.7% to $78.5 per barrel, while US crude futures dropped by 1.7% to $74.15 per barrel.
Commodity prices, including oil, experienced a general decline after the release of the data, as investors speculated that sluggish growth in China would impact demand.
Pivot Point: 74.65
| Resistance level | Support level |
| 75.45 | 73.25 |
| 76.85 | 72.45 |
| 77.70 | 71.05 |
Risk Warning
This material provides real-time market analysis from contributing analysts. Please note that any views expressed in this material do not constitute operational advice. It is important to assess your risk tolerance and make independent trading decisions. STARTRADER holds no responsibility for any trading consequences that may arise from relying on the views expressed in this material.
