

U.S. Dollar Index (USDX)
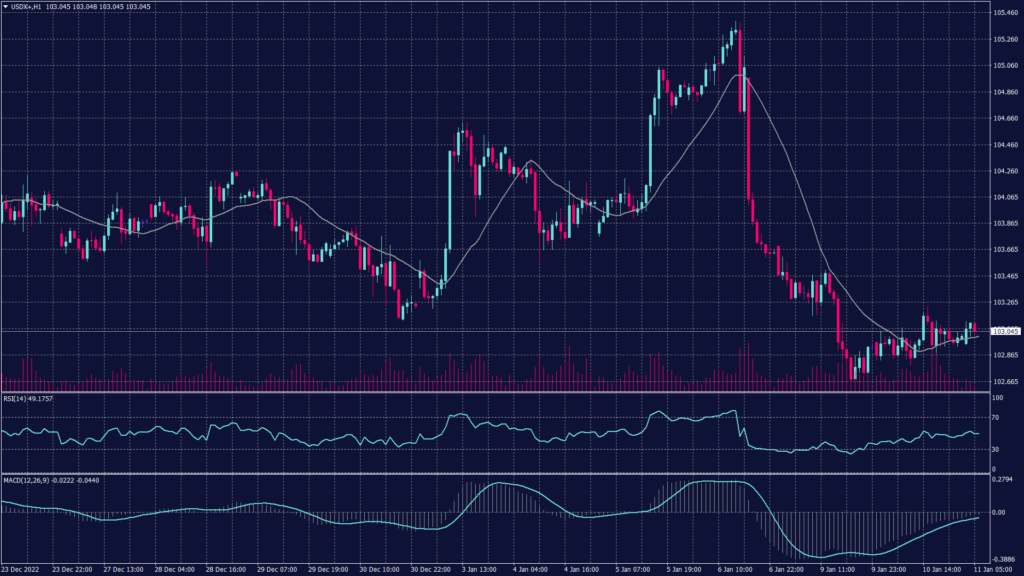
The dollar index was almost flat this morning as the focus is now on the release of CPI data for December. Market participants expect to see inflation easing from the previous month.
The greenback was boosted by comments from Fed members restating that interest rates could rise more than expected this year, especially if inflation runs above the central bank’s target range for longer than expected.
The dollar index trades under heavy selling pressure and remains committed to the downtrend that started in early November. Meanwhile, the hourly chart shows robust selling pressure despite the overselling readings from RSI and MACD.
Pivot Point: 102.80
| SUPPORT | RESISTANCE |
| 102.60 | 103.00 |
| 102.10 | 103.40 |
| 101.60 | 103.60 |
Chinese Yuan (USDCNH)
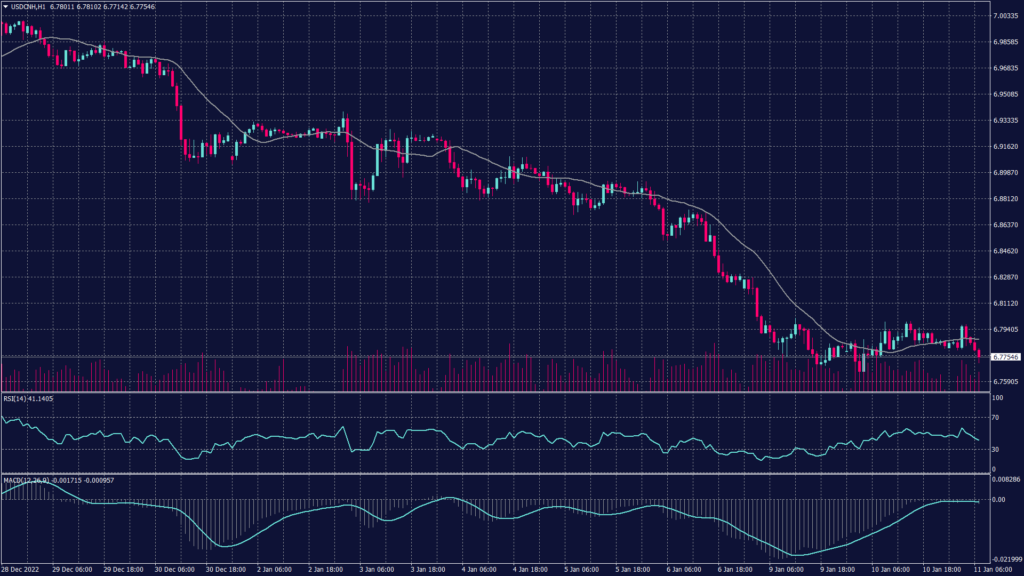
Chinese Yuan trades near its strongest level in almost five-month, with the currency having recorded a strong start to the year with optimism over the relaxation of most anti-COVID curbs in the country.
But this optimism was tempered as China saw its worst, yet COVID-19 outbreak, which is expected to disrupt economic growth even further.
Chinese CPI data for December will be closely monitored, although softening economic growth in the country is expected to result in deflationary trends.
The pair trades in a downtrend on both the hourly and daily chart while the moving average indicates a continuation of the downtrend. Technical indicators signal an increased selling pressure.
Pivot Point: 6.7790
| SUPPORT | RESISTANCE |
| 6.7580 | 6.8740 |
| 6.7325 | 6.9450 |
| 6.6610 | 7.0100 |
Spot Gold (XAUUSD)
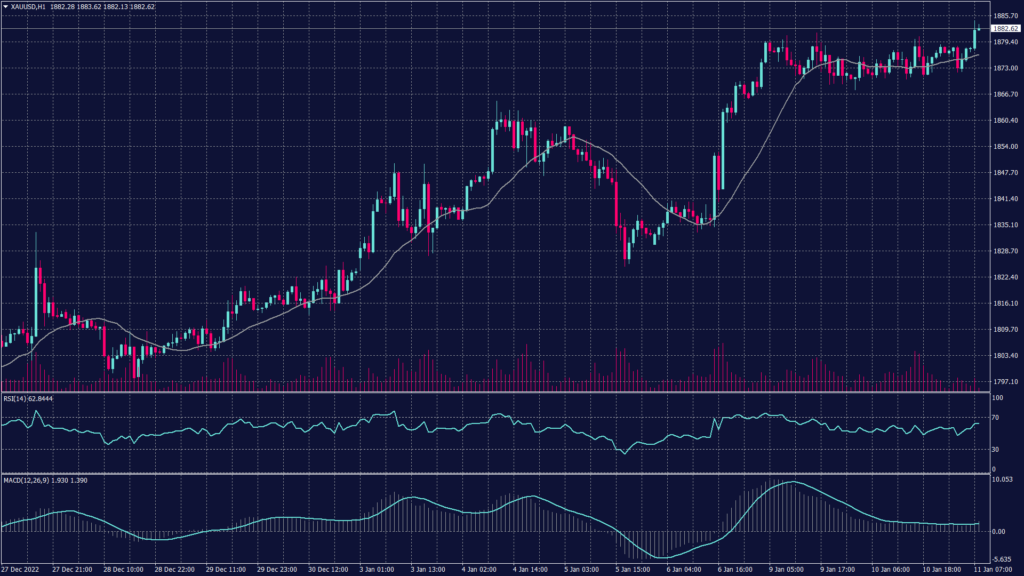
Gold prices hovered near an eight-month high during the early sessions amid a growing number of bets that the Fed will slow its interest rate hikes.
Bullion prices marked a strong start to the year, having gained nearly 3% since last week as the prospect of smaller U.S. rate hikes offered much relief to non-yielding assets. The yellow metal was also buoyed by increased safe-haven demand amid growing concerns over a global recession this year. Meanwhile, Spot gold was flat at $1,877.27 an ounce, while gold futures steadied around $1,881.35 an ounce.
Spot gold remains solid and hits the strong resistance at 1,880 while keeping the buying pressure at the highest levels in a few months. If gold prices broke above 1,880 it is likely to see 1,900 and 1,910. However, if gold failed to break the resistance it will most likely drop between 1,860 and 1,850.
Pivot Point: 1,880
| SUPPORT | RESISTANCE |
| 1,865 | 1,900 |
| 1,860 | 1,910 |
| 1,850 | 1,925 |
WTI Futures (CL-OIL)
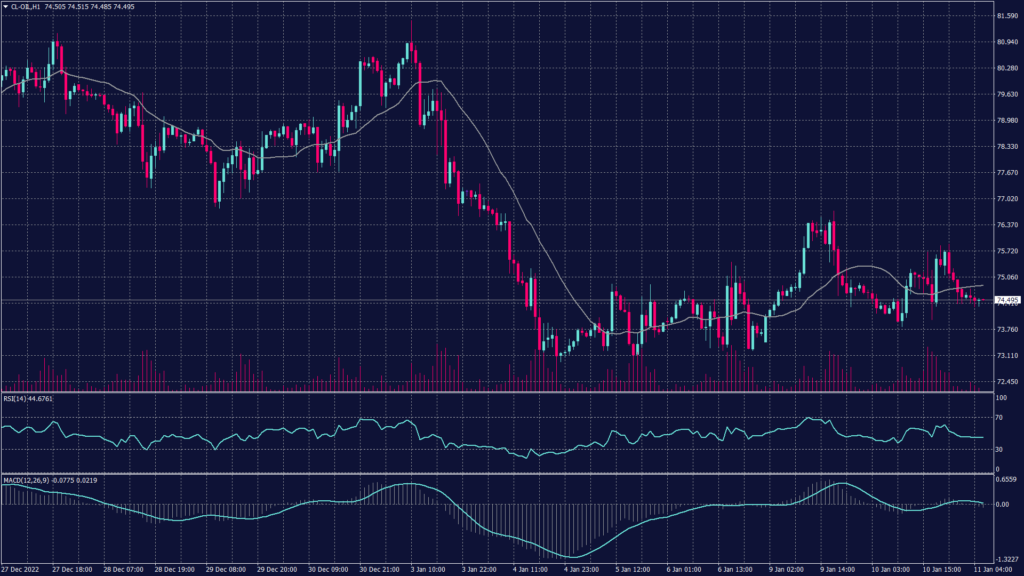
Oil prices fell on Wednesday as an unexpected build in crude and fuel inventories in the U.S., the world’s biggest oil consumer, and economic uncertainty reignited demand worries. WTI futures lost 1.1% to $74.33 a barrel this morning, while Brent crude futures fell by 0.9% to $79.35 a barrel.
On the hourly chart, the WTI chart moves in a wide horizontal range between 73.60 and 75.00 while staying inside the declining channel on the daily chart. Technical indicators stand neutral and moving averages signal a slight advancement from the current prices to $75.
Pivot Point: 74.40
| SUPPORT | RESISTANCE |
| 74.20 | 75.00 |
| 73.60 | 76.00 |
| 73.00 | 76.20 |
