

market news summary
The European Central Bank (ECB) raised the deposit interest rate by 25 basis points to 3.5%, its highest level in 22 years.
European stocks closed lower yesterday, Thursday after the central bank raised borrowing costs as expected and hinted at further tightening of monetary policy to curb persistent inflation. The European Stoxx 600 index ended 0.1% lower at the close after falling 0.8% earlier in the session.
Cryptocurrency prices also declined following the Federal Reserve’s meeting in June, with Bitcoin dropping below $25,000 for the first time since March during Thursday’s trading. Bitcoin decreased by approximately 3.5% to $24,975.51.
Dollar Index (USDX)
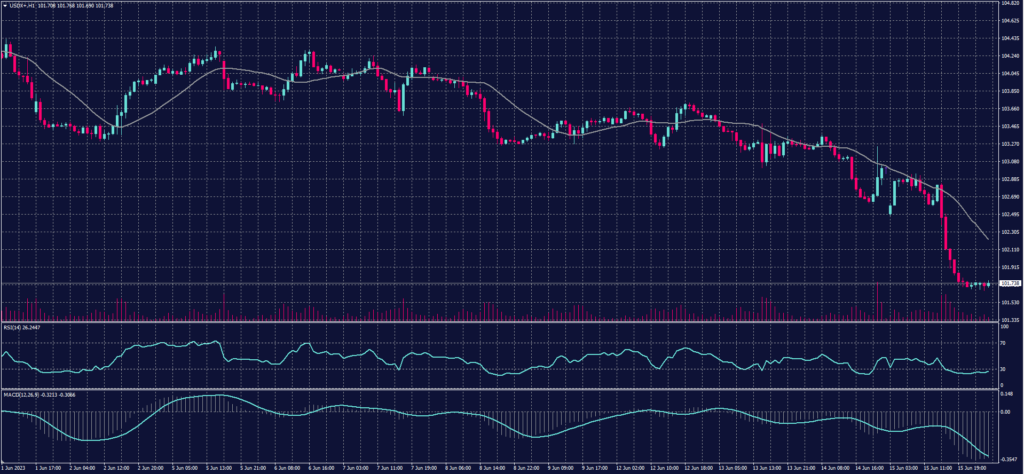
The dollar trimmed its losses briefly after data showed unexpectedly strong US retail sales in May, rising 0.3% last month after a 0.4% increase in April. Economists surveyed by Reuters had expected a 0.1% decline in sales.
However, the dollar index declined later that day, which measures the performance of the US currency against a basket of other major currencies, falling 0.2% in its latest trading to reach 102.76.
Pivot point: 102.10
| Resistance level | Support level |
| 102.55 | 101.30 |
| 103.35 | 100.85 |
| 103.80 | 100.00 |
Spot Gold (XAUUSD)
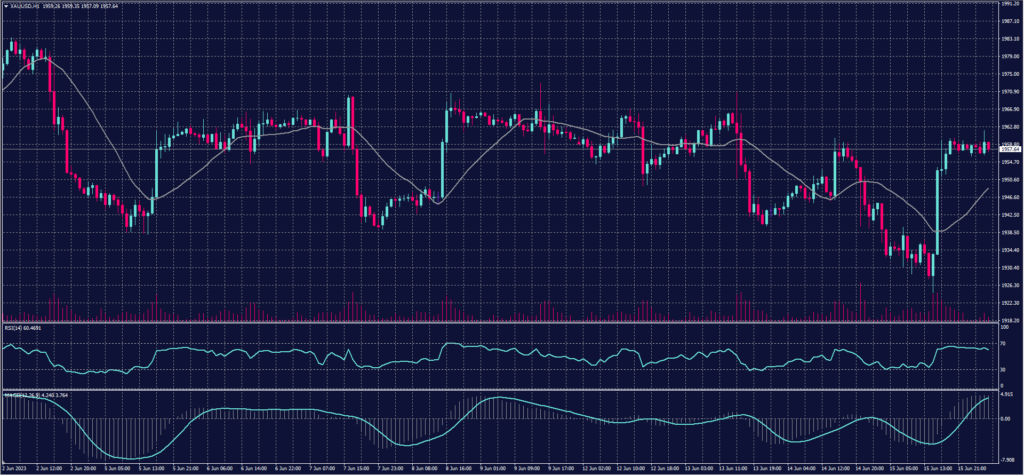
Gold prices rose from a three-month low on Thursday as the dollar and bond yields declined following US economic data but concerns over the Federal Reserve resuming interest rate hikes limited the gains.
Spot gold increased by 0.4% to $1,950.59 per ounce after hitting its lowest level since March 17. US gold futures, however, fell by 0.3% to $1,962.90.
Pivot point: 1947
| Resistance level | Support level |
| 1970 | 1934 |
| 1983 | 1911 |
| 2000 | 1900 |
Dow Jones Index (DJ30ft – US30)
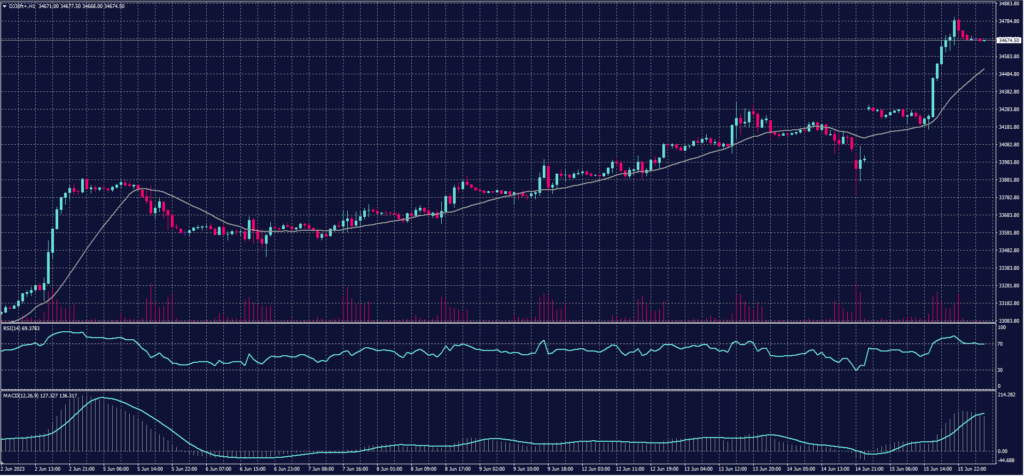
US indices closed higher on strong gains in Thursday’s session, supported by investor optimism as the Federal Reserve’s tightening cycle approaches after the release of weak economic data. The data showed that unemployment claims remained unchanged at a seasonally adjusted rate of 262,000 for the week ending June 10, but it was higher than economists’ expectations of 249,000 claims.
The Dow Jones Industrial Average rose by approximately 1.3%, or around 428 points, on Thursday, reaching its highest level in over 6 months. The S&P 500 and Nasdaq Composite indexes also increased by 1.2% and 1.15%, respectively.
Both indices marked their sixth consecutive daily gain and reached their highest level in 14 months.
Pivot point: 34555
| Resistance level | Support level |
| 34940 | 34305 |
| 35190 | 33920 |
| 35575 | 33670 |
US Crude (USOUSD)
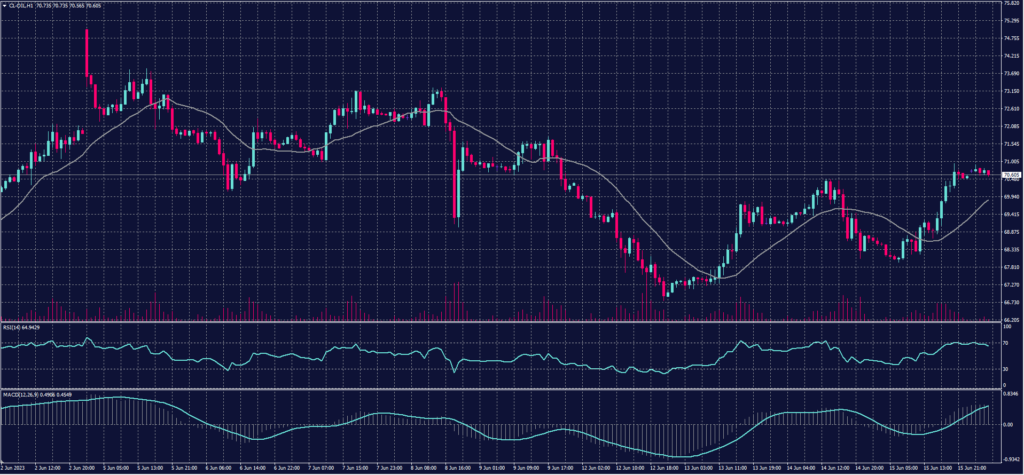
Oil prices stabilized on Thursday, June 15, after a significant decline on Wednesday. The market balanced between a surge in refinery production in China, the world’s largest crude oil importer, and weak economic expectations there.
Brent crude futures increased by 0.34% to $75.76 per barrel, while West Texas Intermediate (WTI) crude oil rose by 2.71% to $71.05 per barrel.
Pivot point: 69.80
| Support level | Resistance level |
| 68.70 | 71.65 |
| 66.80 | 72.80 |
| 65.70 | 74.65 |
Risk Warning
This material provides real-time market analysis from contributing analysts. Please note that any views expressed in this material do not constitute operational advice. It is important to assess your risk tolerance and make independent trading decisions. STARTRADER holds no responsibility for any trading consequences that may arise from relying on the views expressed in this material.
