

U.S. Dollar Index (USDX)
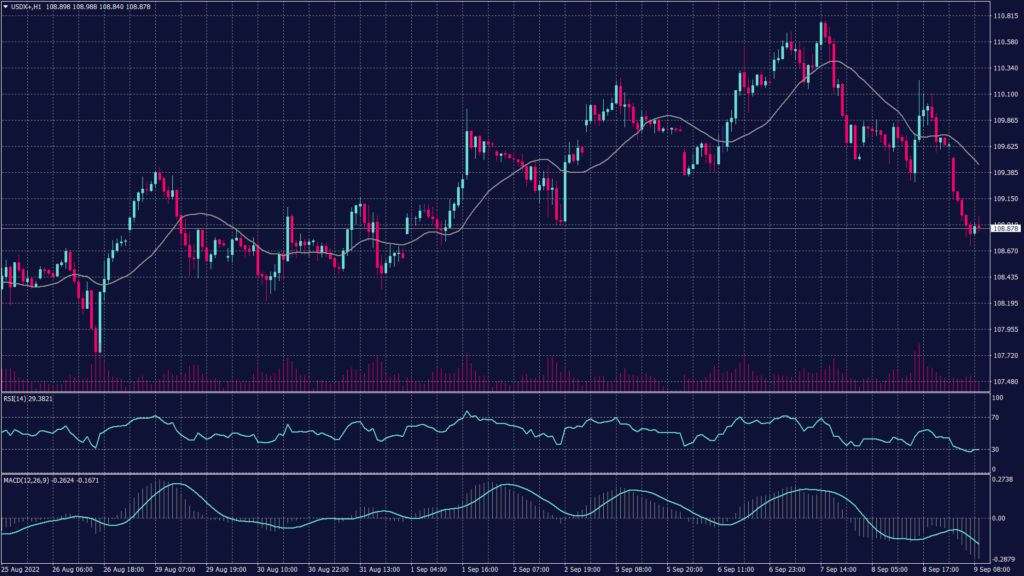
The dollar took a breather from its surging rally on Friday as markets digested yet more hawkish Fed speak, while the euro hung on to parity, helped by an outsized rate hike from the European Central Bank. Currency movement overnight was calm for once even as Federal Reserve Chair Jerome Powell reaffirmed the central bank’s aggressive stance against inflation, which reinforced the greenback’s dominance.
This morning, the U.S. dollar index was down to 108.72 before bouncing a little towards 108.90. Meanwhile the 10-year Treasury yield has recovered to a 3.304% high on the day from a low of 3.201%. The two-year yield reached a high of 3.506% from a low of 3.404% and is currently up 1.45% on the day.
Technically, the dollar index shows further decline on the short term but remains positive as an overall trend. The moving averages on the daily chart show support at 108.50 and 107.05 on the daily chart. Meanwhile, Fibonacci retracement shows support at 108.70, 107.60 and 107.10 on the same timeframe. However, the hourly chart shows a possible negative fluctuation towards 108.40.
Pivot Point: 108.85
| SUPPORT | RESISTANCE |
| 108.70 | 109.00 |
| 108.55 | 109.15 |
| 108.40 | 109.35 |
Euro (EURUSD)
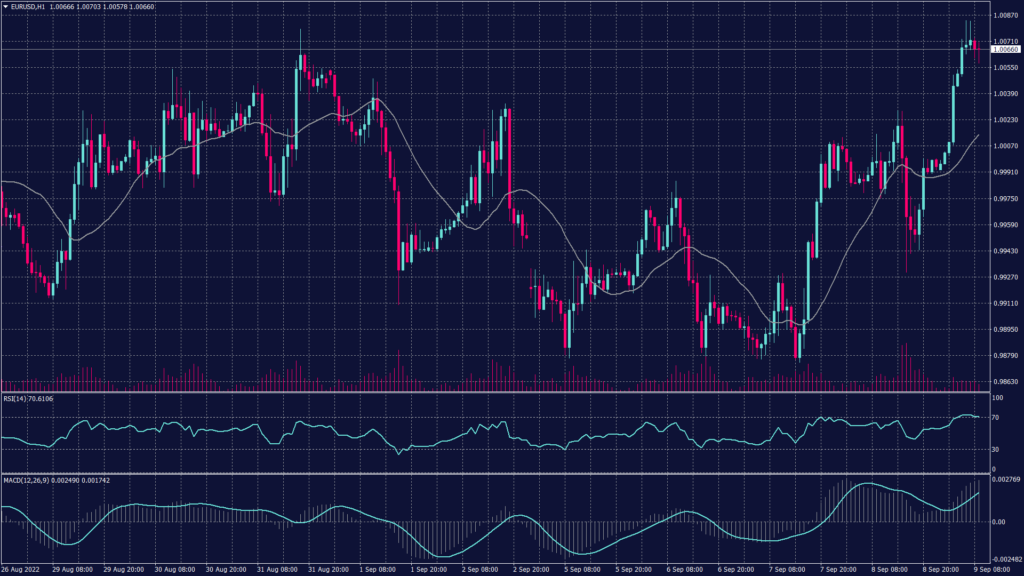
The euro was up 0.52% at $1.0050, inching away from its two-decade trough of $0.9864 hit earlier in the week as speculators took profits on crowded short positions.
The ECB on Thursday raised its key interest rates by an unusual 75 basis points and promised further hikes to come in its fight against inflation, even as the bloc is likely heading towards a winter recession and gas rationing. The single currency is on track for a 0.9% weekly gain, snapping three straight weeks of decline, but has nonetheless fallen more than 10% this year.
The common currency remains weak and moving on this moving on the downtrend in the daily chart. Meanwhile, the hourly chart shows light support at 0.9870 which might not hold against the heavy bearish pressure.
Pivot Point: 1.0050
| SUPPORT | RESISTANCE |
| 0.9980 | 1.0080 |
| 0.9950 | 1.0100 |
| 0.9870 | 1.0200 |
Spot Gold (XAUUSD)
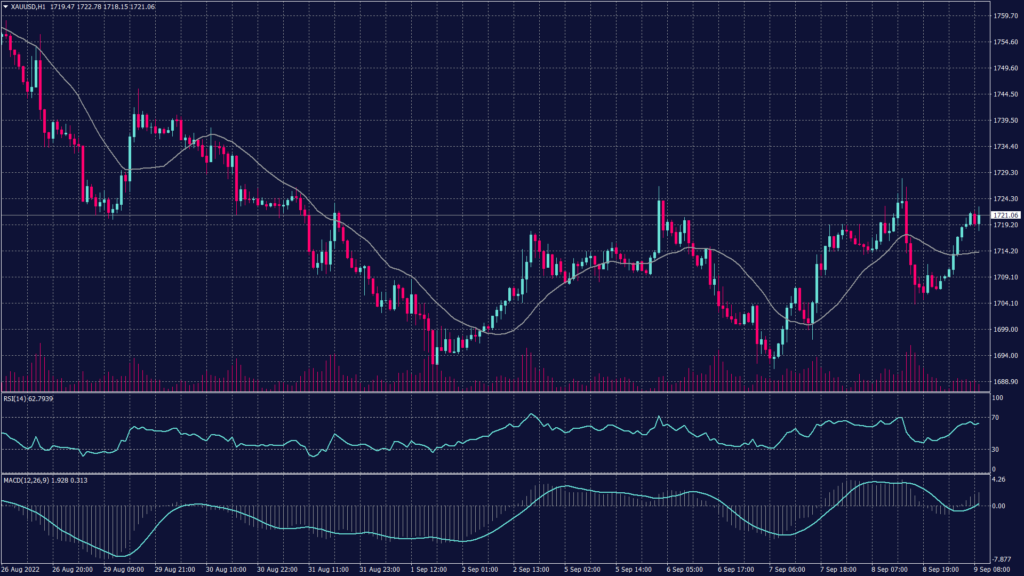
The gold price is down on the day after falling heavily from a high of $1,728.23 to a low of $1,704.00. The yellow metal is trading around $1,709.33 at the time of writing and lowing some 0.5%. The US dollar index and shorter-dated US Treasury yields rose on Thursday following Federal Reserve Chair Jerome Powell’s comments that the central bank was “strongly committed” to controlling inflation.
From a 4-hour chart perspective, the harmonic pattern is playing out with the price correcting higher. The price has stalled ahead of a 38.2% Fibonacci retracement level on two levels of rise. The third attempt could be more successful and a break of 1,730 might be significant.
Spot gold is showing a double bottom formation on the hourly chart which is yet to be confirmed on the daily chart. However, if gold prices penetrated the levels of 1,726, they will head to 1,740 which will be a possible platform for a new rise.
Pivot Point: 1,720
| SUPPORT | RESISTANCE |
| 1,710 | 1,737 |
| 1,705 | 1,740 |
| 1,680 | 1,742 |
West Texas Crude (USOUSD)
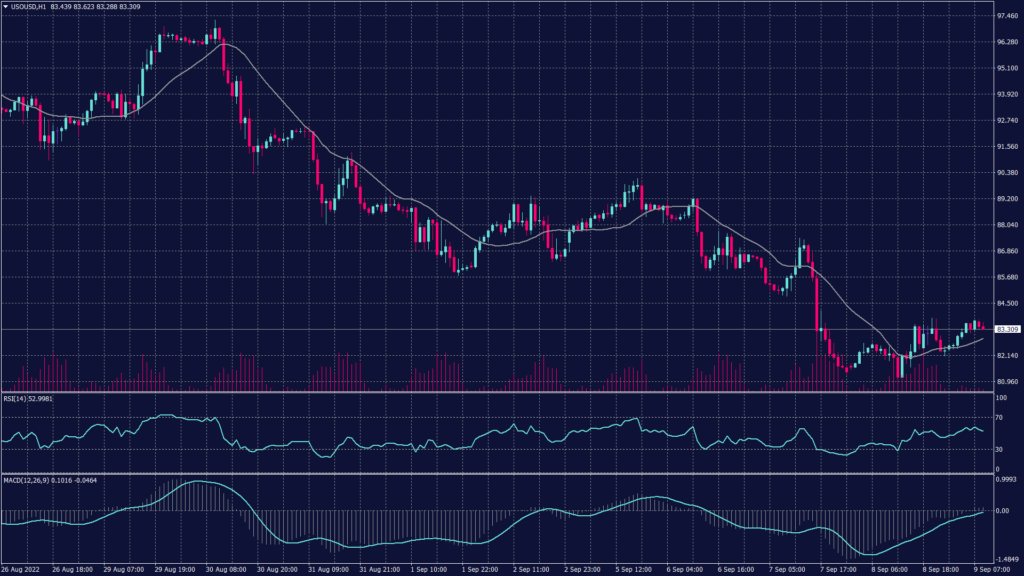
Crude oil prices slightly changed during the Asian session. Meanwhile, market participants are trying to reprice the unexpected build in U.S. crude inventories. However, experts expected crude inventories to decline on concerns that slowing global economic growth will weigh on demand.
Brent oil rose 0.4% to $88.88 a barrel, while West Texas Intermediate fell 0.4% to $83.20 a barrel.
Spot WTI traded lower breaking below the support at $86.70 per barrel and hitting the next support at $82.20 per barrel. The overall trend remains negative on the daily chart and signals breaking the support levels at $81.20 per barrel.
Pivot Point: 83.15
| SUPPORT | RESISTANCE |
| 81.20 | 86.90 |
| 77.50 | 89.70 |
| 71.70 | 91.20 |
