

U.S. Dollar Index (USDX)
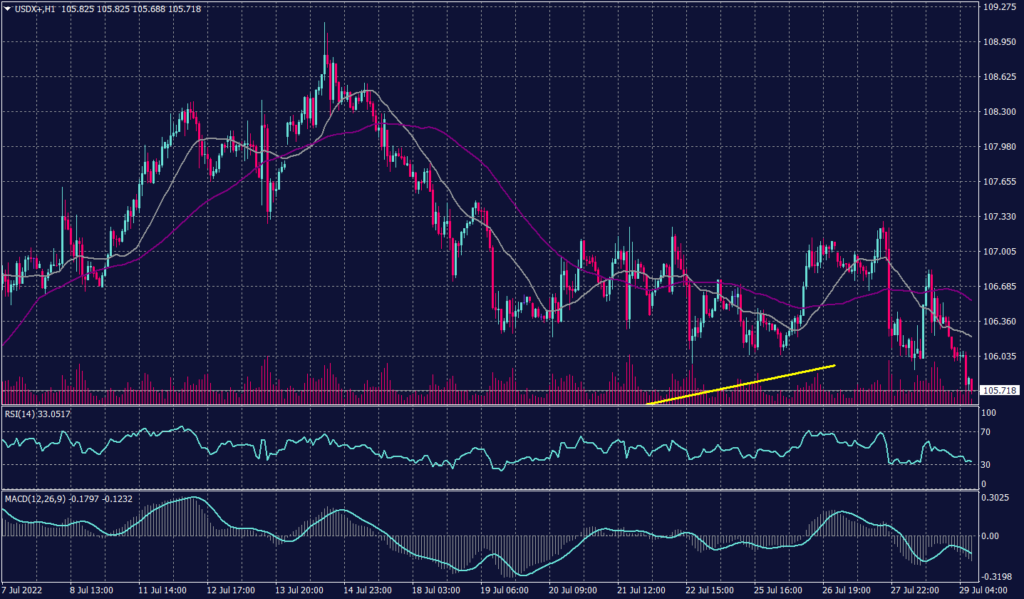
U.S. second-quarter gross domestic product (GDP) contracted at a 0.9% annualized rate, which followed a first-quarter contraction of 1.6%. Meanwhile, some market experts expect the Fed to slow its pace of rate hikes to half a point at the next meeting in September. The dollar index edged 0.03% higher to 106.25 this morning, after dipping to a more than three-week low of 106.05 on Thursday.
Technically, the U.S. dollar index is trading at the uptrend line on the daily chart and might close the day below it near the support at 105.10. Technical indicators on the daily chart signal a high probability of further decline towards the range of 105.10 and 104.50.
Meanwhile, the index is slowing the decline on the hourly chart with 3 consecutive candles bottomed at 105.70 but the decline is likely to continue.
PIVOT POINT: 105.77
| SUPPORT | RESISTANCE |
| 105.60 | 105.85 |
| 105.50 | 105.90 |
| 104.90 | 106.20 |
Euro (EURUSD)
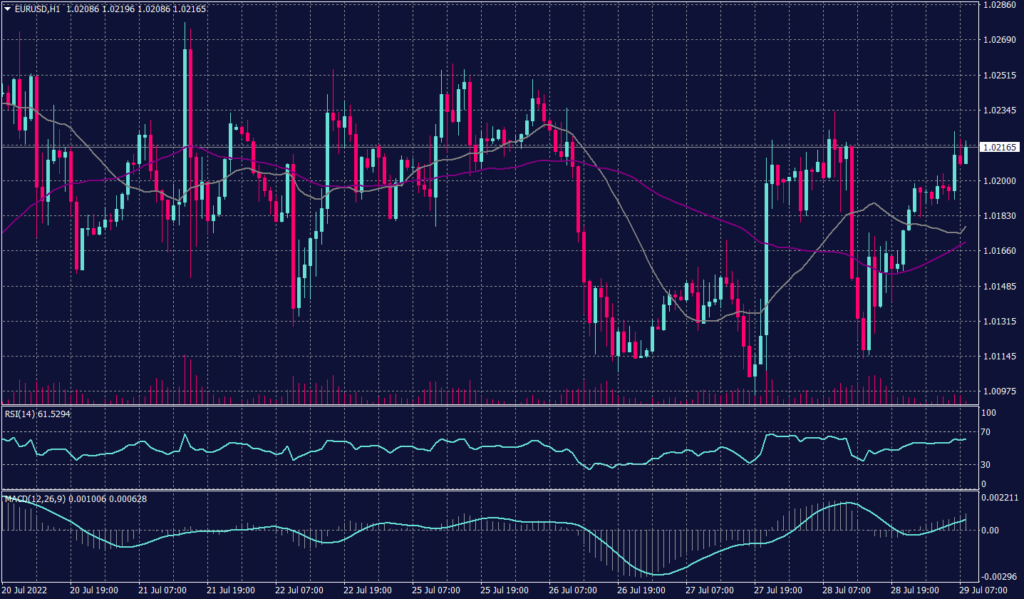
The euro was flat at $1.01945 after a see-saw session on Thursday that ultimately ended with little changed. Meanwhile, Eurozone is facing recessionary risks amid an ongoing energy crisis. The International Monetary Fund has warned that if Russia, which reduced gas delivery to Europe this week, completely cuts off supplies by year-end, the region could face zero economic growth next year.
The pair hit a solid resistance at 1.02125 which led to the decline on the hourly chart. However, the daily chart shows a continuation of the downward pattern targeting the parity level. Meanwhile, technical indicators show declining signals.
PIVOT POINT: 1.0210
| SUPPORT | RESISTANCE |
| 1.0100 | 1.0270 |
| 0.9960 | 1.0350 |
| 0.9850 | 1.0470 |
Spot Gold (XAUUSD)
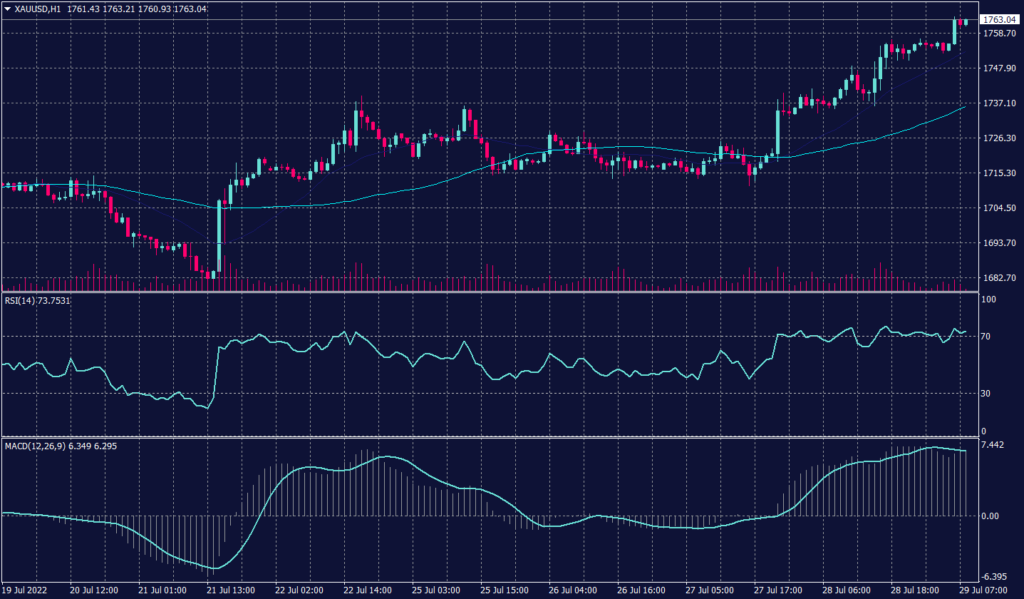
Gold was up 0.40% to $1,757.30 on Friday morning during the Asian session as anticipations of further Fed rate hikes receded. The U.S. Federal Reserve on Wednesday raised interest rates by 75 basis points to 2.25-2.5% as markets expected. Meanwhile, U.S. Gross Domestic Product GDP released on Thursday fell at a 0.9% annual rate in the second quarter, which lifted bullion’s safe-haven allure.
The precious metal is trading in the third consecutive green candle on the daily chart supported by the heavy demand and massive traded volumes. Although gold prices hit the highest since July 6, the positive trend hit the resistance below 1,768 and it might slow if not revers. However, if the uptrend continued the prices are unlikely to penetrate 1,789.
Meanwhile, the hourly chart remains optimistic despite technical indicators reaching theoretical peaks. However, golds chart confirms the strong resistance below 1,768 which might push prices back.
PIVOT POINT: 1,765
| SUPPORT | RESISTANCE |
| 1,761 | 1,768 |
| 1,753 | 1,774 |
| 1,745 | 1,789 |
West Texas Crude (USOUSD)
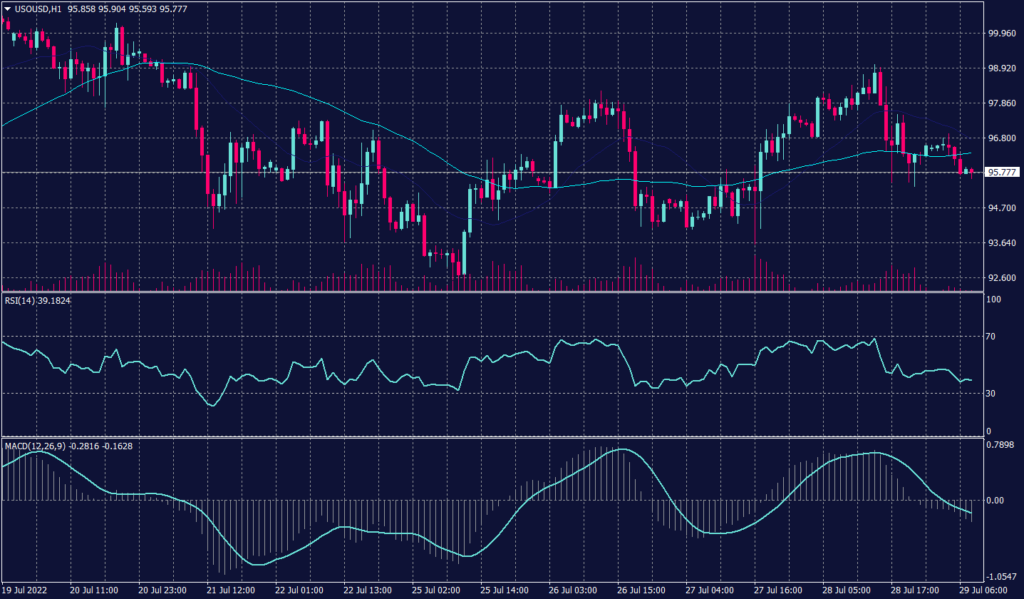
Oil prices were steady during the Asian session on Friday, lifted by supply concerns as attention turns to the next OPEC+ meeting, though fears of recession capped gains. West Texas Intermediate crude rose 0.4% to $96.80 a barrel, reversing losses from the previous session and on track for a nearly 3% rise for the week. Meanwhile, Brent crude traded horizontally at $107.14 a barrel.
WTI is trading horizontally on the Daily chart right above the support at 93.50 while technical indicators confirm the slowing pattern. Meanwhile, the hourly chart is moving in a tight range between 93.50 and 96.60 with a tendency to reach $92 a barrel if broken.
PIVOT POINT: 96.25
| SUPPORT | RESISTANCE |
| 95.70 | 96.60 |
| 95.10 | 97.70 |
| 93.60 | 98.90 |
