

Market News Summary
Euro remains at five years low;
Crude oil trend is unclear;
Gold indecisive;
Bitcoin set for further decline.
U.S. DOLLAR INDEX
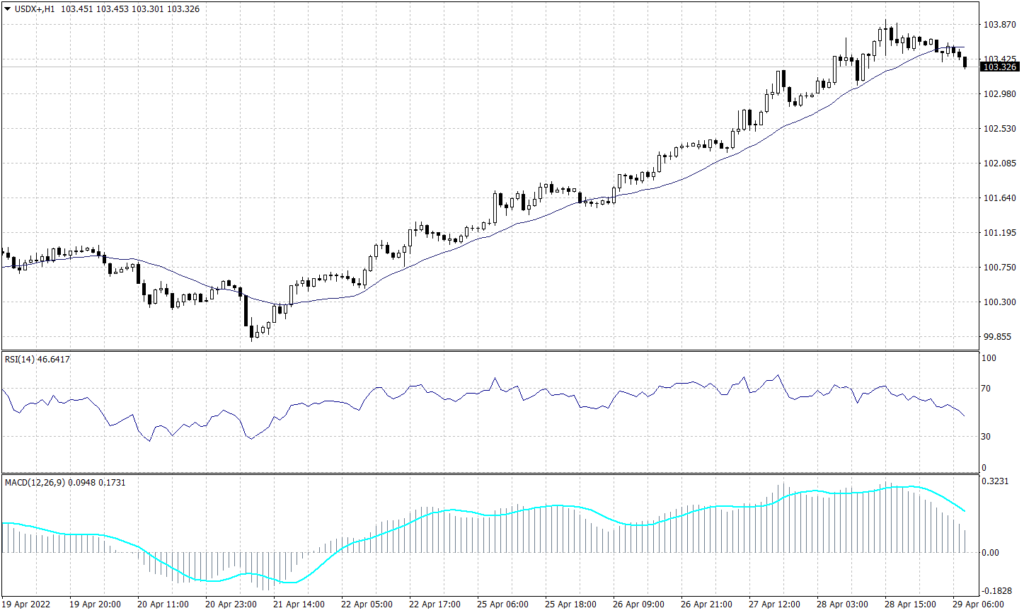
The price of the US index has reached an all-time high of roughly 104.00, indicating that it is in an overall optimistic trend. The hourly chart shows a price retreat to the level of 103.50, which could either see the price continue higher and breach the barrier of 104.00 or form a reversal to the level of 101.10 before the bulls reclaim control. Technical indicators like the RSI and MACD, on the other hand, continue to show prices moving upward.
PIVOT POINT: 103.50
| R1 | R2 | R3 | |
| RESISTANCE | 103.80 | 104.00 | 104.40 |
| S1 | S2 | S3 | |
| SUPPORT | 103.10 | 102.80 | 102.50 |
Euro (EURUSD)
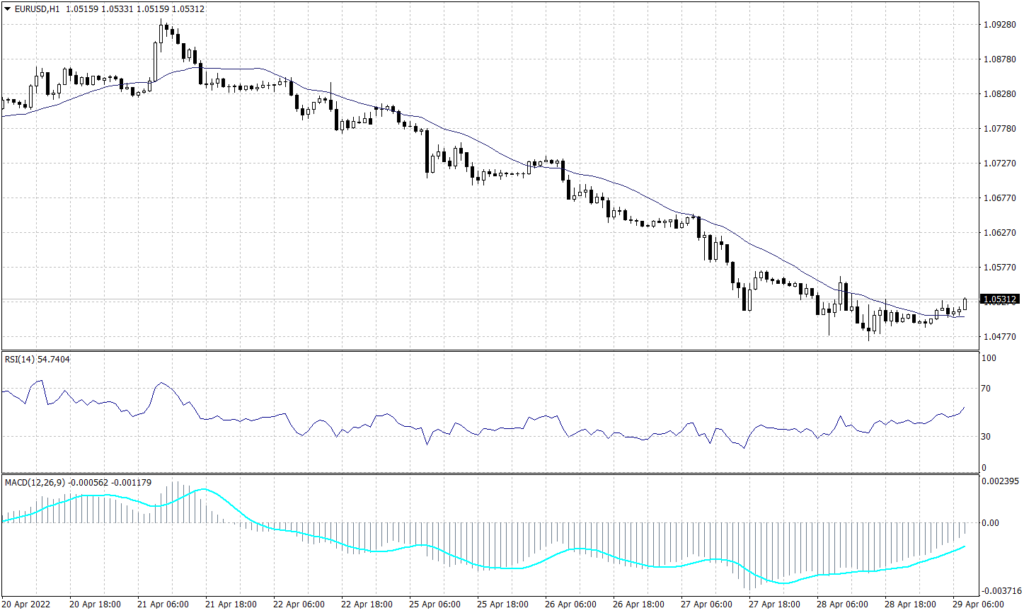
The Euro traded at its lowest rate in five years yesterday. Although the Euro traded higher during the early trades, the chart shows a continuation of the downtrend. However, for the pair to bounce it requires a huge positivity in the economic data and improvement on the geopolitical side.
The readings from the RSI and MACD are diverging from the present price action. As the technical indicators show stability around the current levels, while price action indicates a probability to drop further.
PIVOT POINT: 1.0520
| R1 | R2 | R3 | |
| RESISTANCE | 1.0575 | 1.0610 | 1.0650 |
| S1 | S2 | S3 | |
| SUPPORT | 1.0490 | 1.0455 | 1.0410 |
Sterling Pounds (GBPUSD)
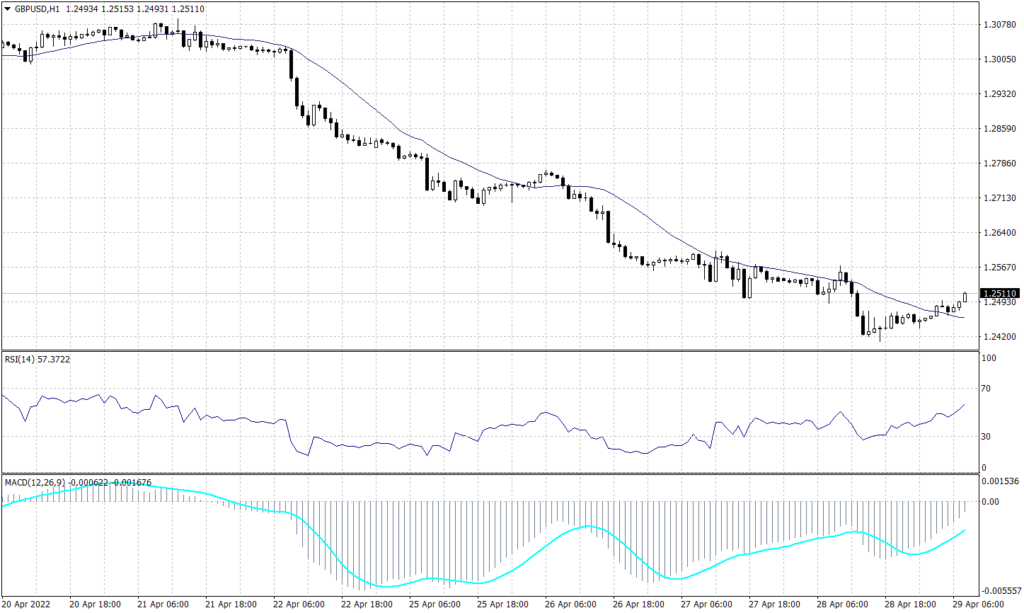
The Cable retains its downtrend as the bulls struggle to pull the trend in their favor. It is expected for the sterling pound to reach the low of 1.2300 before bulls reclaim the driver’s seat.
Like the neighbour currency, GBPUSD readings from the RSI and MACD are diverging from the present price action. As the technical indicators show stability around the current levels, while price action indicates a probability to drop towards 1.2300.
PIVOT POINT: 1.2500
| R1 | R2 | R3 | |
| RESISTANCE | 1.2565 | 1.2635 | 1.2690 |
| S1 | S2 | S3 | |
| SUPPORT | 1.2440 | 1.2360 | 1.2300 |
Japanese Yen (USDJPY)
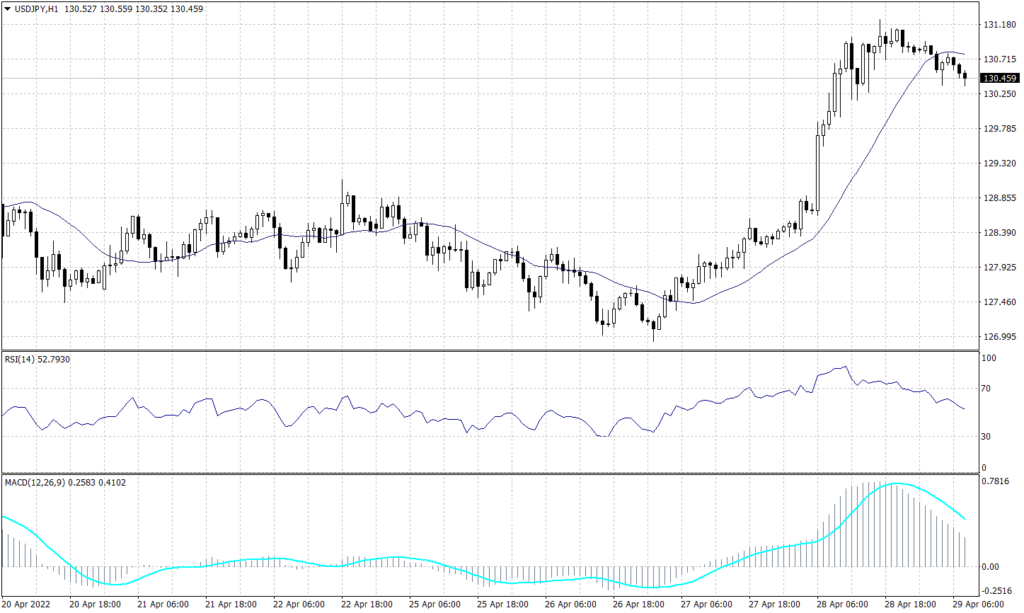
The USDJPY has been on a positive trend, with the price approaching a 20-year high of 133.10. Price is also moving in a bullish trend on the lower chart, as it is retesting a level 130.35 following an initial impulsive rise to the upside. Technical indicators like the RSI and MACD imply that price will continue to rise.
PIVOT POINT: 130.35
| R1 | R2 | R3 | |
| RESISTANCE | 131.20 | 132.10 | 133.10 |
| S1 | S2 | S3 | |
| SUPPORT | 129.70 | 129.10 | 128.60 |
Spot Gold (XAUUSD)
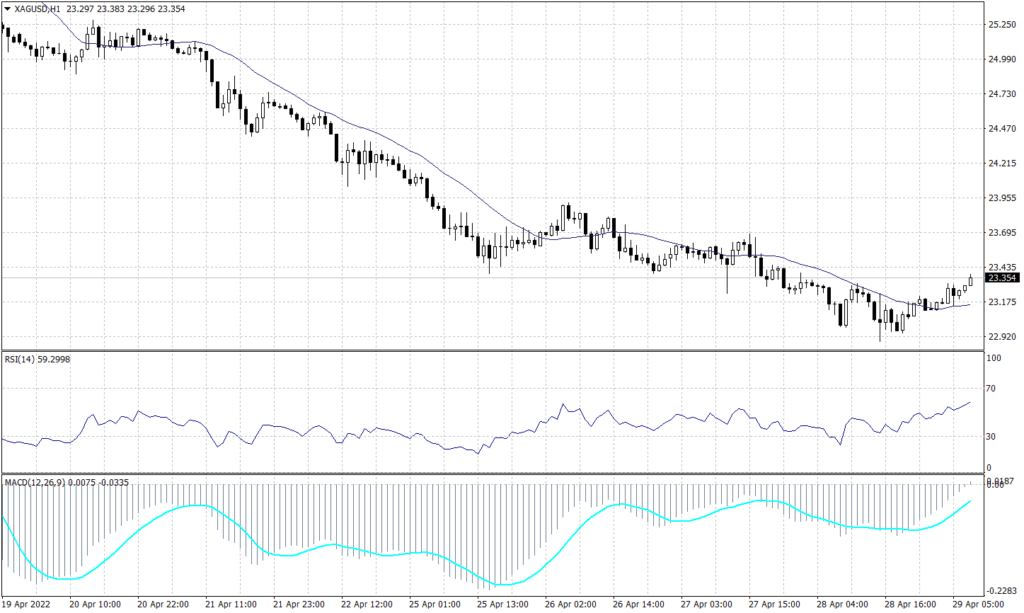
Gold has bounced yesterday above the level of 1,900 reaching 1,908 this morning. However, there will be no sign of a continuation of the uptrend unless prices broke above the emotional support of 1,920. On a daily time, frame, the general trend for the Gold remains negative, as the price is currently near 1,910, intersecting the rebound of the downward trend line.
The hourly chart shows a retracement of price to the trend line, which could result in a bounce off the trend line before the price continues to fall. Furthermore, both the RSI and the MACD imply that the bearish trend will continue.
PIVOT POINT: 1905
| R1 | R2 | R3 | |
| RESISTANCE | 1,910 | 1,917 | 1,920 |
| S1 | S2 | S3 | |
| SUPPORT | 1,890 | 1,880 | 1,875 |
WTI (USOUSD)
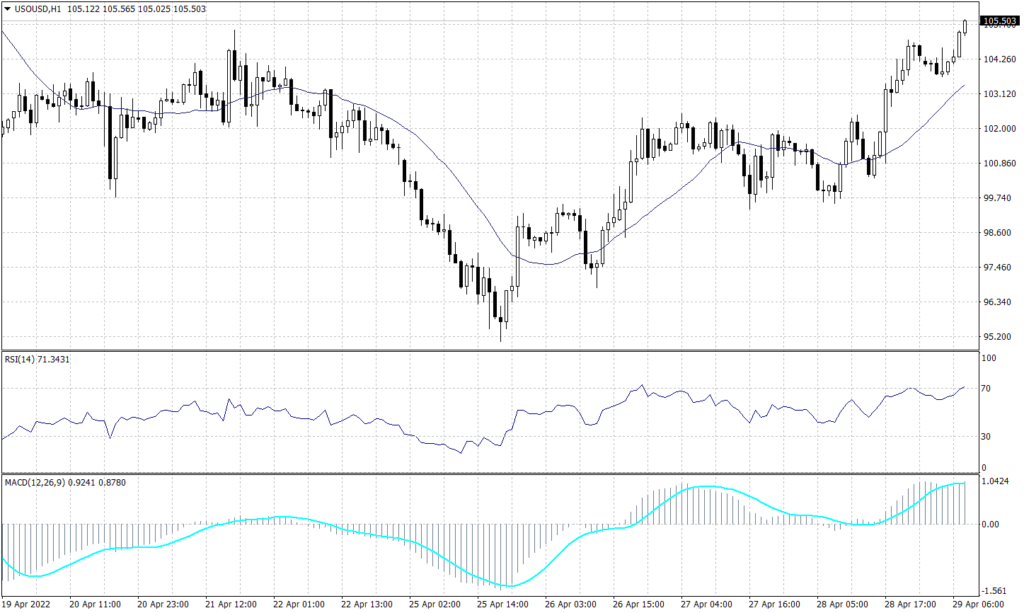
WTI gained $2 yesterday amid the improved outlook towards the Chinese lockdown effect over crude oil demand. U.S. Crude is currently trading at $105.50 per barrel, which triggered the downtrend signal shown on the MACD.
Since this movement is purely news dependent, the trend is not clear unless crude oil prices broke out of the channel between $107 up which may drive the prices towards $115 or break beneath $103 which may drag the prices towards $100.80.
PIVOT POINT: 105.20
| R1 | R2 | R3 | |
| RESISTANCE | 106.40 | 107.90 | 109.00 |
| S1 | S2 | S3 | |
| SUPPORT | 103.90 | 102.85 | 101.55 |
Bitcoin (BTCUSD)
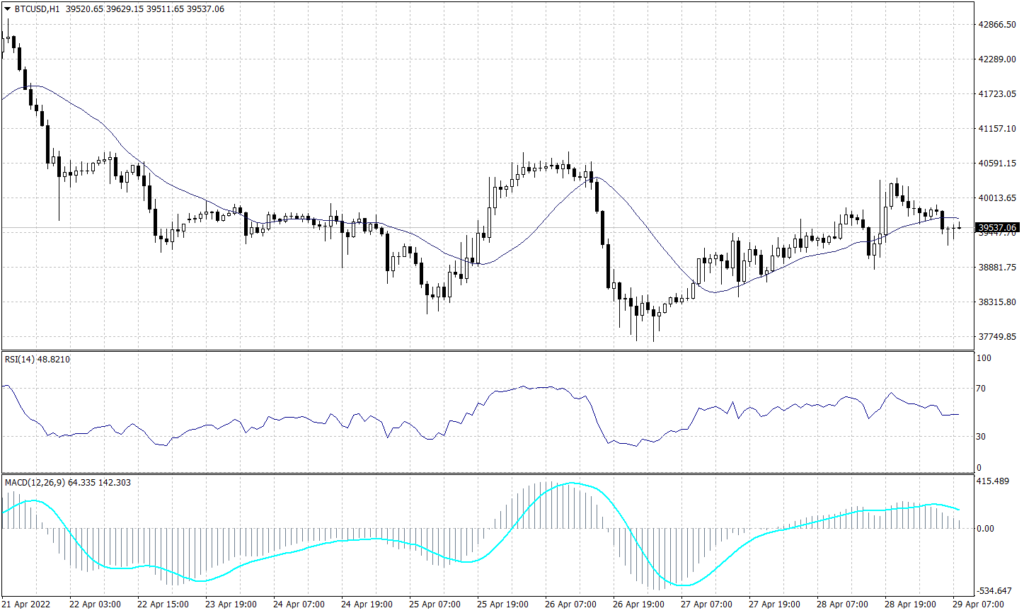
Despite the heavy bullish pressure, the Bitcoin trend remains solid bearish. While prices are moving horizontally, they have formed a reversal pattern between the Fibonacci levels of 50.0 and 61.8. Thus, the daily time frame trend remains unfavourable. Furthermore, both the RSI and MACD indicators show a likelihood of further decline.
PIVOTPOINT: 39,500
| R1 | R2 | R3 | |
| RESISTANCE | 39,700 | 40,100 | 40,655 |
| S1 | S2 | S3 | |
| SUPPORT | 38,890 | 38,680 | 38,360 |
