

Market News Summary
Euro continues the fall;
Swiss Franc at new low;
Gold is supported at 1,900.
Euro (EURUSD)
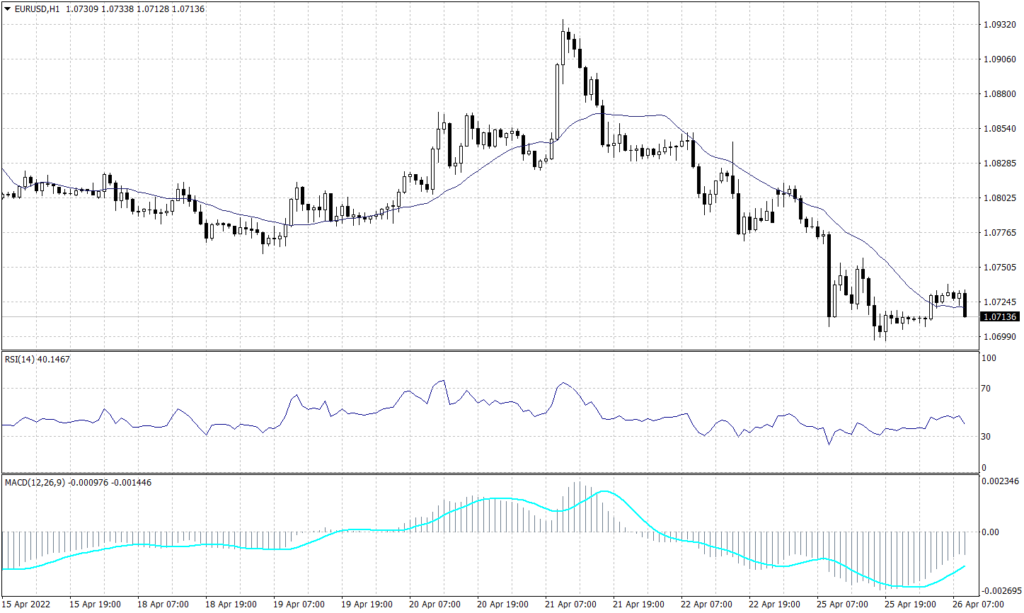
On the daily chart of the Euro, the overall trend remains bearish. Similarly, the price is currently intersecting the negative trend line and the level of 1.0725 on the hourly chart, indicating a significant downturn. The RSI and MACD both imply price continuation to the downside.
PIVOT POINT: 1.0725
| R1 | R2 | R3 | |
| RESISTANCE | 1.0760 | 1.0780 | 1.0810 |
| S1 | S2 | S3 | |
| SUPPORT | 1.0710 | 1.0670 | 1.0640 |
Swiss Franc (USDCHF)
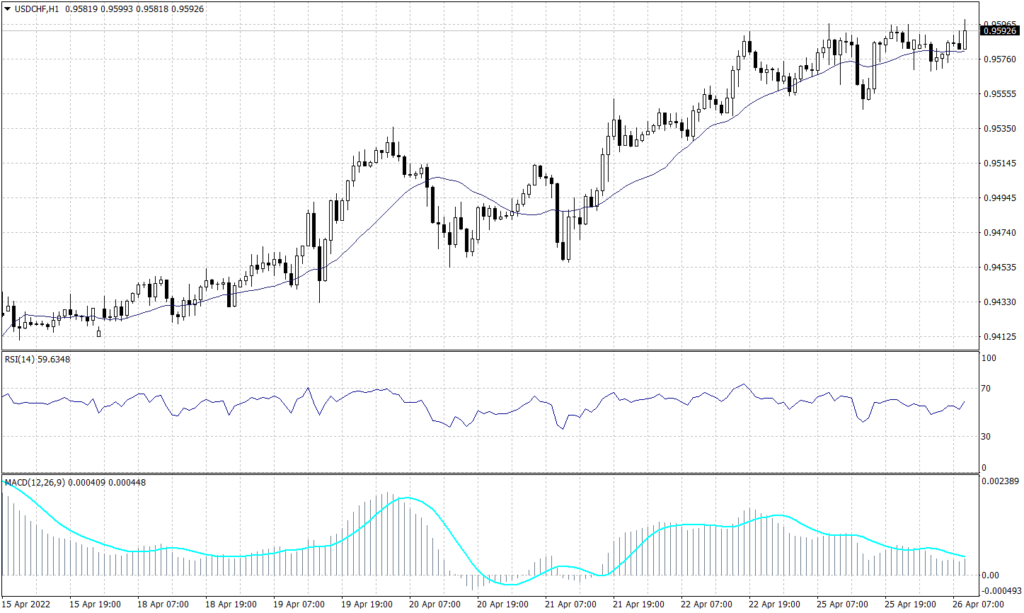
The overall trend of the Swiss Franc price in the daily time frame is bullish. Similarly, pricing has produced a succession of higher highs in the hourly time frame, indicating that prices will continue to rise. Although the price is now stabilizing at 0.9590, the RSI and MACD technical indicators suggest no clear trend.
PIVOT POINT: 0.9590
| R1 | R2 | R3 | |
| RESISTANCE | 0.9610 | 0.9640 | 0.9670 |
| S1 | S2 | S3 | |
| SUPPORT | 0.9570 | 0.9545 | 0.9525 |
Spot Gold (XAUUSD)
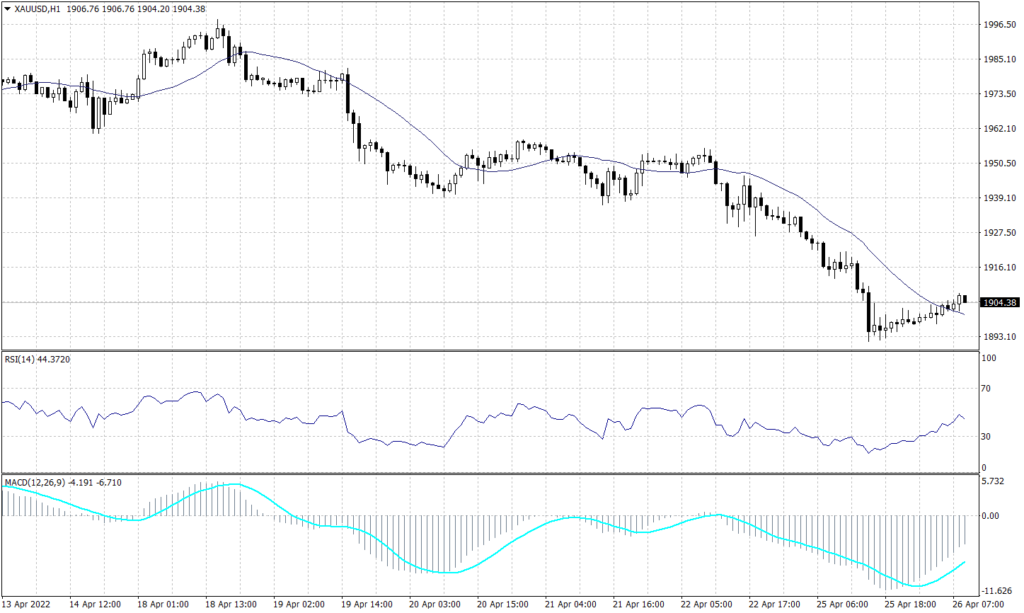
Gold has rallied back from a previous support level of 1,890, which has been held since March 29th. On the hourly chart, the price appears to be making a series of lower lows, and is currently at 1,905, intersecting the 20-candle moving average. Both the RSI and the MACD point to a likely continuation of the downward trend.
PIVOT POINT: 1,905
| R1 | R2 | R3 | |
| RESISTANCE | 1,915 | 1,920 | 1,930 |
| S1 | S2 | S3 | |
| SUPPORT | 1,890 | 1,880 | 1,870 |
WTI (USOUSD)
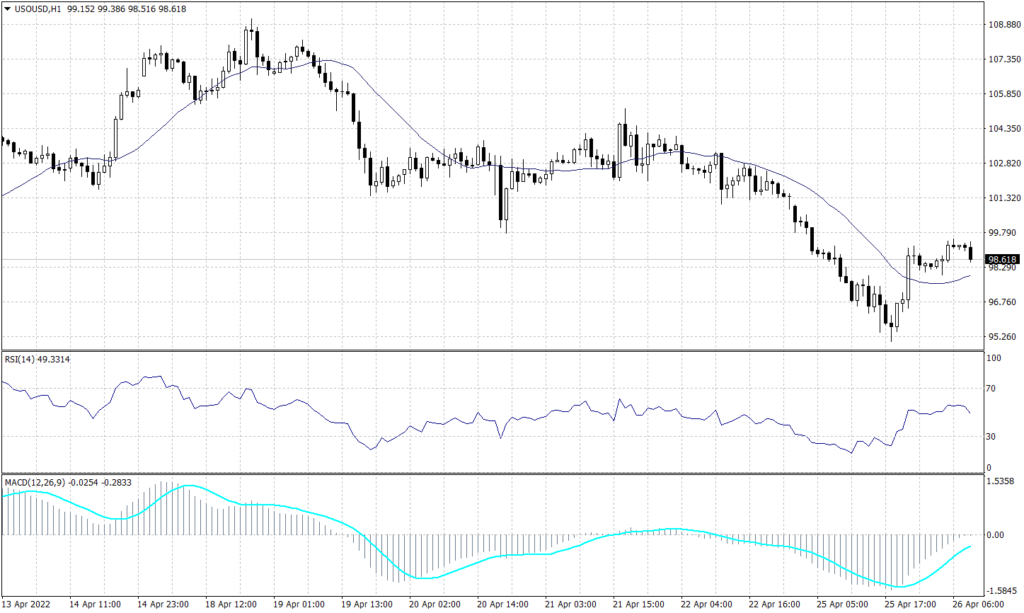
WTI is now trading at $99.70 per barrel. Around the current price of USOUSD from the hourly time frame, there appears to be an intersection between the Fibonacci retracement level of 61.8 and the downward trend line, which might lead to a likely price continuation to the downside. The RSI and MACD both indicate a bearish trend.
PIVOT POINT: 99.70
| R1 | R2 | R3 | |
| RESISTANCE | 101.55 | 102.90 | 104.10 |
| S1 | S2 | S3 | |
| SUPPORT | 97.80 | 96.30 | 94.40 |
Bitcoin (BTCUSD)
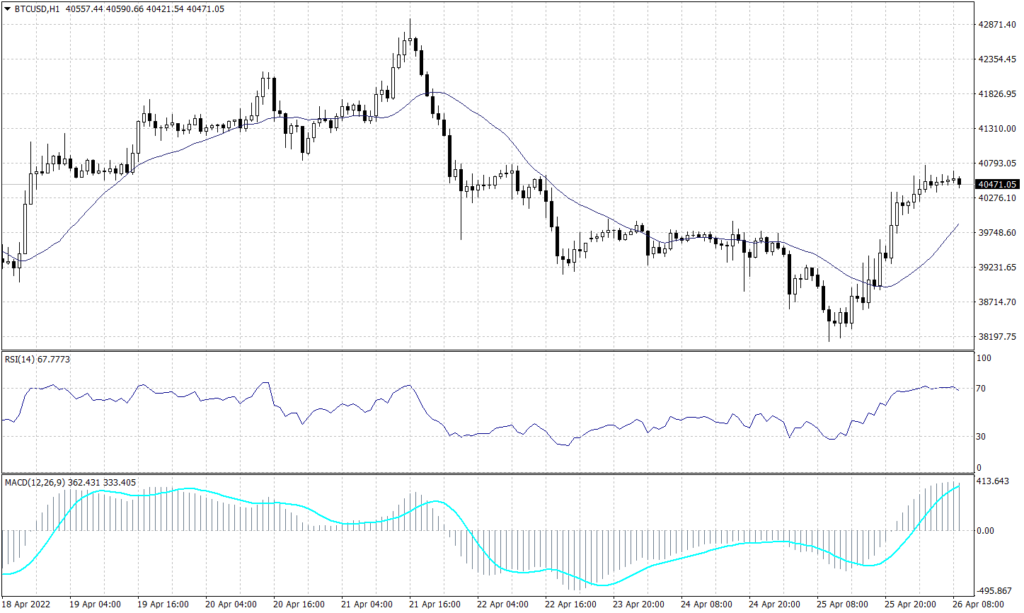
On the daily chart of Bitcoin, a potential bearish flag can be seen, which could lead to a downward trend. After a strong pullback from the support level of 38,140, the hourly chart trend is likewise bearish. The RSI indicates an overbought condition, while the MACD indicates a possible price decline.
PIVOT POINT: 40,605
| R1 | R2 | R3 | |
| RESISTANCE | 41,250 | 41,990 | 42,920 |
| S1 | S2 | S3 | |
| SUPPORT | 39,840 | 39,025 | 38,140 |
