

U.S. Dollar Index (USDX)
The dollar moved on a firm footing during the Asian session, as traders braced for a sharp U.S. interest rate hike this week and looked for safety as data points to a weakening global economy.
The greenback was up slightly against most majors during the early trades as the Fed concludes a two-day meeting on Wednesday and markets priced for a 75-basis-point (bp) rate hike.
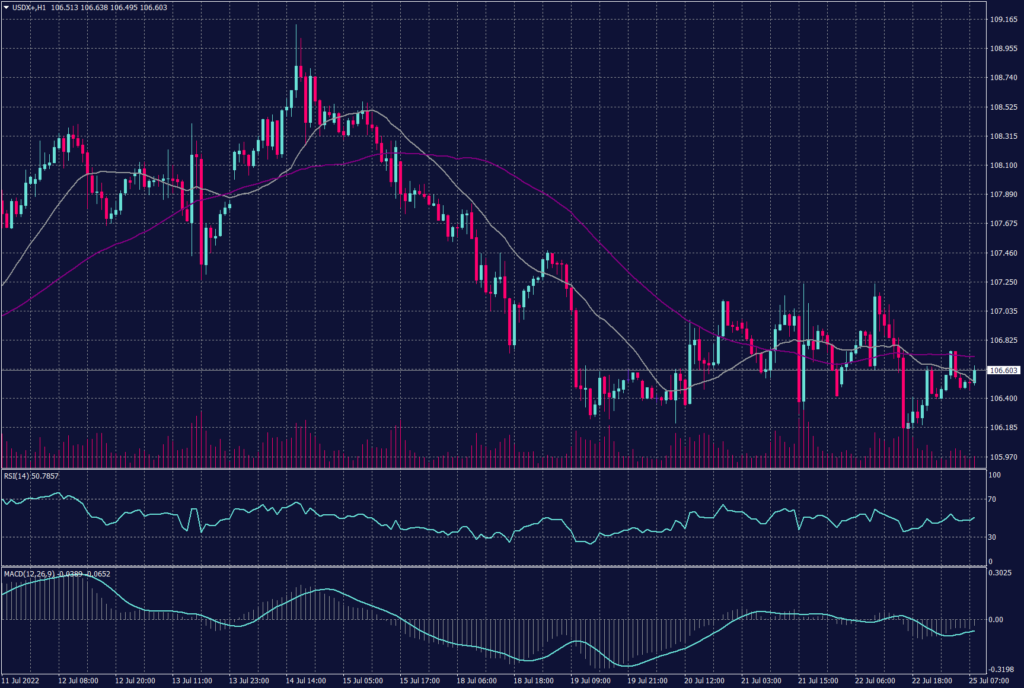
On the hourly chart, technical indicators show a possibility of continuation of the downtrend as RSI is heading to 30 while MACD shows a slight tendency for downward movement. Meanwhile, the hourly chart shows a volatile trend between 106 and 106.8. However, the index signals a possible resistance below 106.60.
PIVOT POINT: 106.60
| SUPPORT | RESISTANCE |
| 106.50 | 106.85 |
| 106.40 | 107.40 |
| 106.20 | 107.70 |
Euro (EURUSD)
The has euro ended its best week since May on Friday after the European Central Bank (ECB) raised borrowing costs more than expected overnight in its first rate hike since 2011. The European Central Bank hiked interest rates by 50 basis points on Thursday to contain soaring inflation.
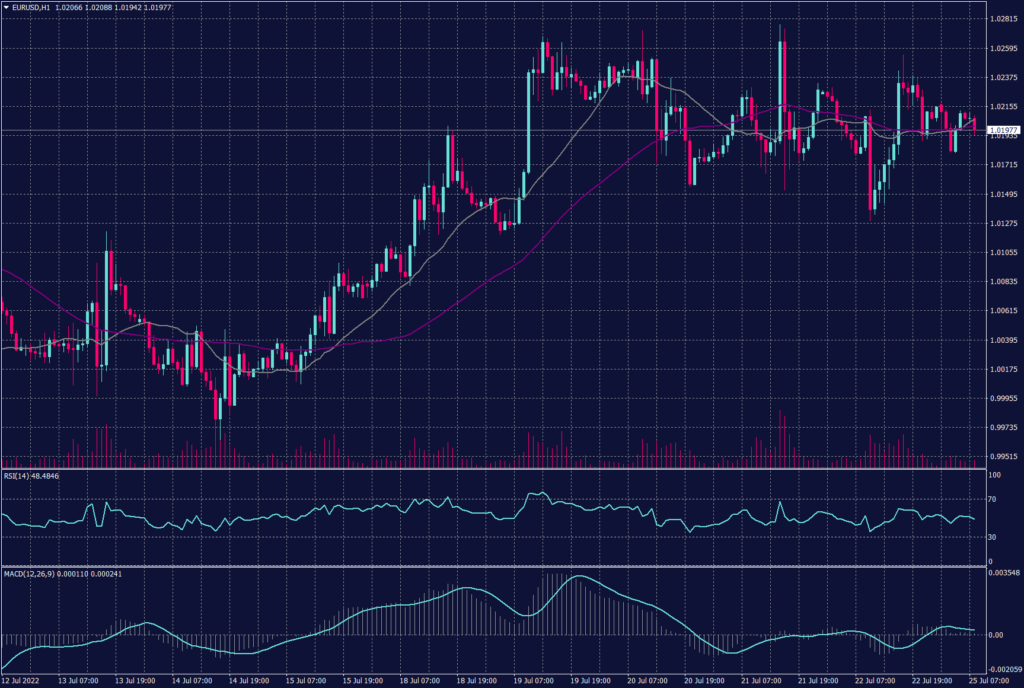
Meanwhile, the hourly chart reflects a corrective movement in a long secondary trend targeting 1.0550 as the next resistance. However, the daily chart remains to hold the negative trend aiming towards 0.9960.
PIVOT POINT: 1.0200
| SUPPORT | RESISTANCE |
| 1.0100 | 1.0270 |
| 0.9960 | 1.0350 |
| 0.9850 | 1.0470 |
Spot Gold (XAUUSD)
Gold traded 0.16% lower to $1,724.55 during the Asian session while traders expect a 75-basis-point interest rate hike by the Fed this week. However, due to the aggressive policy adopted by the Fed, gold prices have dropped more than $350 since early March. Additionally, experts expect the ECB to continue its recent approach and hike another 50bp which will give a boost to the bonds market over billions.
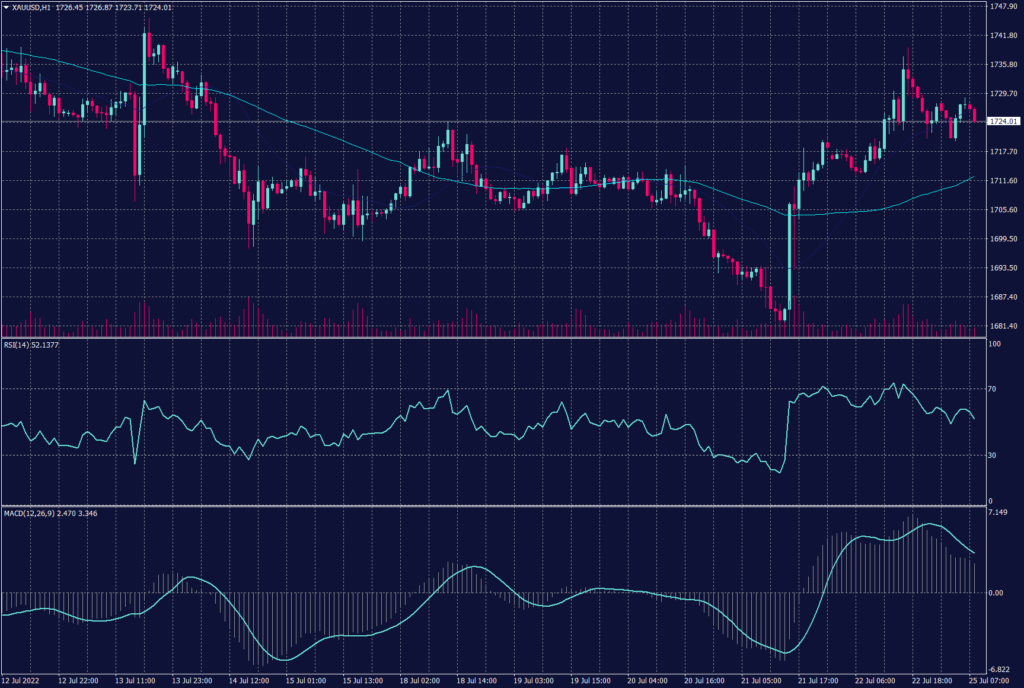
Daily gold chart shows a tendency for a decline but it also showing support above $1,700. Meanwhile, the hourly chart shows smaller candles and shorter range which indicates a possibility of an impulsive downwards movement. Technical indicators also confirm the possibility of the decline.
PIVOT POINT: 1,720
| SUPPORT | RESISTANCE |
| 1,700 | 1,726 |
| 1,680 | 1,733 |
| 1,675 | 1,740 |
West Texas Crude (USOUSD)
Crude Oil traded lower this morning on concerns that an expected interest rate hike from the Fed could dent fuel demand. Meanwhile, Brent oil lost 0.81% to $97.58 while WTI crude dipped 0.79% to $93.95. On the supply side, Libya’s National Oil Corporation (NOC) aims to bring back production to 1.2 million barrels per day (bpd) in two weeks.
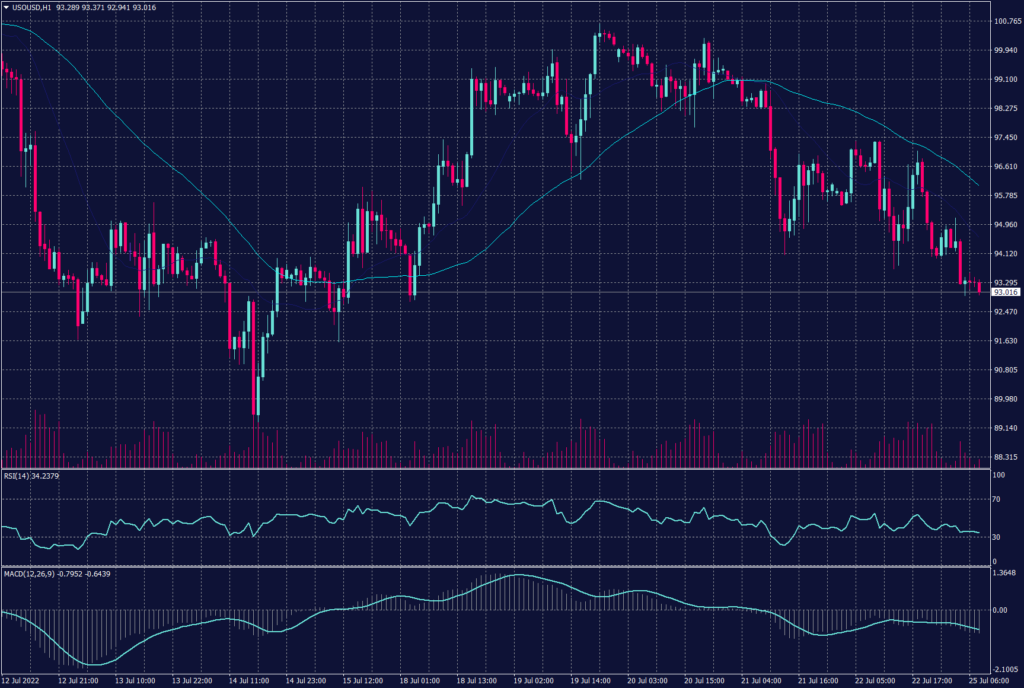
On the hourly chart, WTI prices are showing an extended declining trend from $96.6 a barrel to $93 per barrel. Additionally, technical indicators confirm the decline while moving average is showing a continuation.
PIVOT POINT: 92.90
| SUPPORT | RESISTANCE |
| 92.50 | 94.10 |
| 91.60 | 95.00 |
| 90.50 | 95.80 |
