

market news summary
U.S. Dollar Index (USDX)
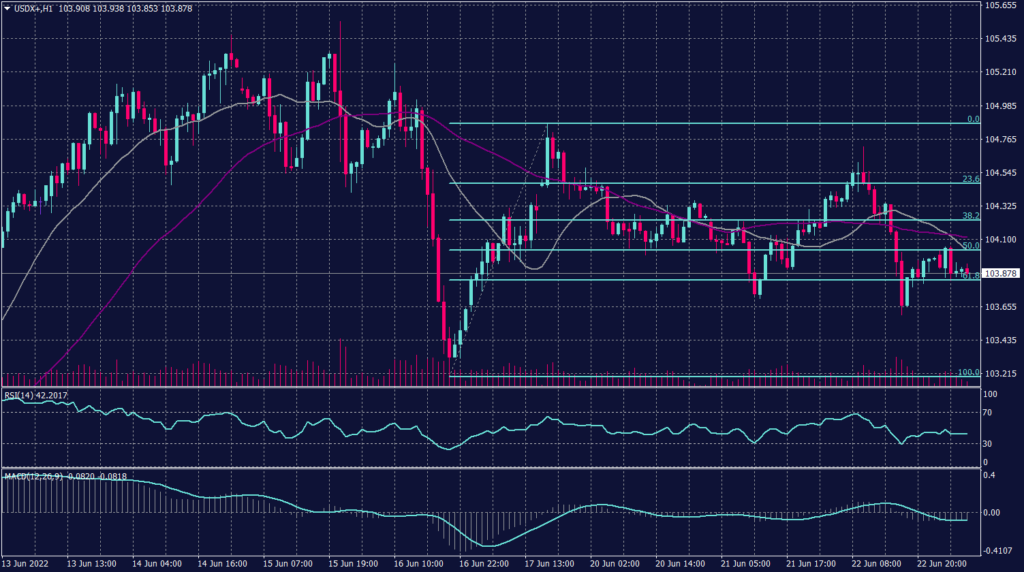
The U.S. dollar stayed under tension as it looked set to extend declines against major peers. The U.S. Dollar was hurt by Treasury yields floundering near two-week lows amid rising concerns of a recession.
The dollar index, which measures the currency against six key rivals, slipped 0.07% to 104.14, bringing its decline since Friday to 0.44%. It has fallen 1.54% from the two-decade peak of 105.79 reached on June 15, when the Federal Reserve raised rates by 75 basis points – the biggest hike since 1994.
Technically:
The USDX traded lower today to trade below 104 as recession fears increase. Meanwhile, the USDX remains in a horizontal pattern pressuring the support at 103.50. Additionally, hourly chart price action indicates a further decline while the technical indicators are neutral.
Meanwhile, the daily chart indicates a continuation of the uptrend in the longer term. Technical indicators confirm the continuation and moving averages show a slower rise. Fibonacci retracements show support around 104.00.
PIVOT POINT: 104.00
| SUPPORT | RESISTANCE |
| 103.50 | 104.60 |
| 102.60 | 105.10 |
| 102.30 | 105.60 |
Sterling Pound (GBPUSD)
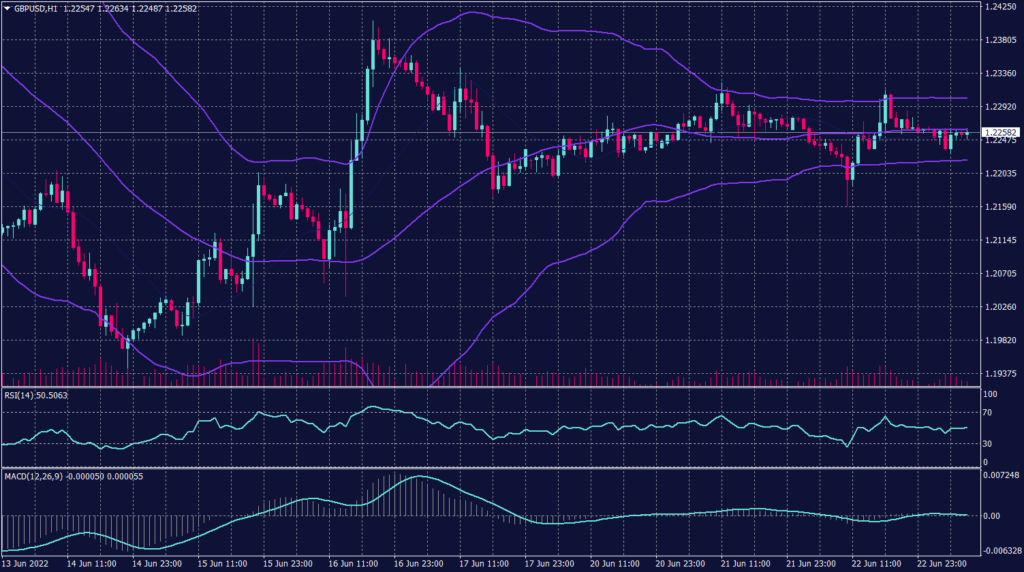
The sterling pound is moving horizontally and shows a caution trading environment. On the daily chart, the pair remains to weaken and targets its lowest level since March 2020 between 1.1446 and 1.1410. The cable cannot find shelter in the upcoming BOE statement unless it massively exceeded market expectations.
PIVOT POINT:1.2280
| SUPPORT | RESISTANCE |
| 1.1950 | 1.2300 |
| 1.1820 | 1.2380 |
| 1.1700 | 1.2480 |
Spot Gold (XAUUSD)
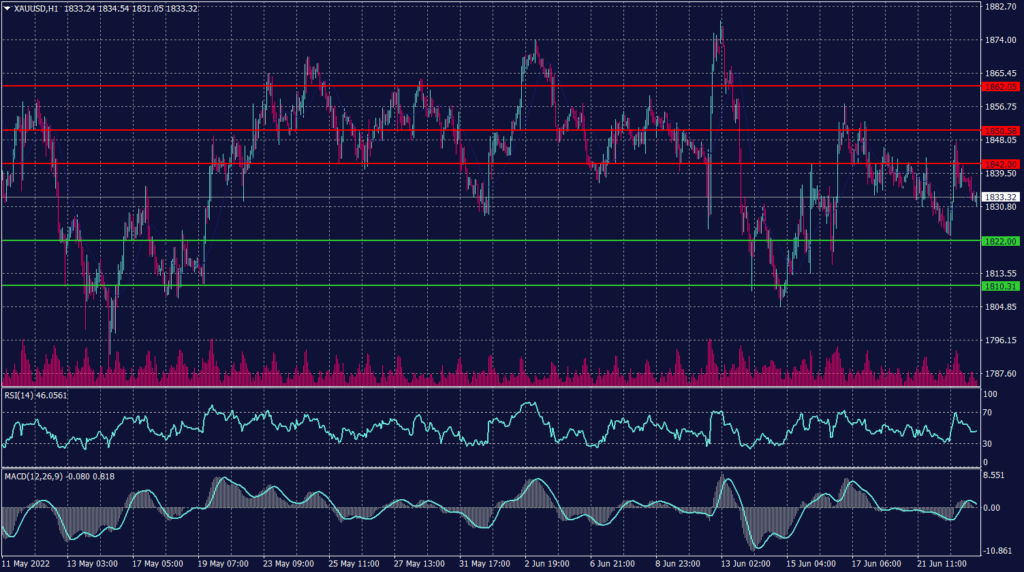
Gold was down on Wednesday morning in Asia as the U.S. dollar firmed ahead of U.S. Federal Reserve Chair’s two-day testimony where investors are expecting to seek more clues on monetary policies.
Fed Chair Jerome Powell will start a two-day testimony to Congress later in the day, with investors looking to see more clues on if the Fed will deliver another interest rate hike of 75 basis points.
Spot gold may test a support at $1,821 per ounce, with a good chance of breaking below this level and falling to $1,810.
PIVOT POINT: 1,830
| SUPPORT | RESISTANCE |
| 1,815 | 1,842 |
| 1,810 | 1,850 |
| 1,790 | 1,855 |
West Texas Crude (USOUSD)
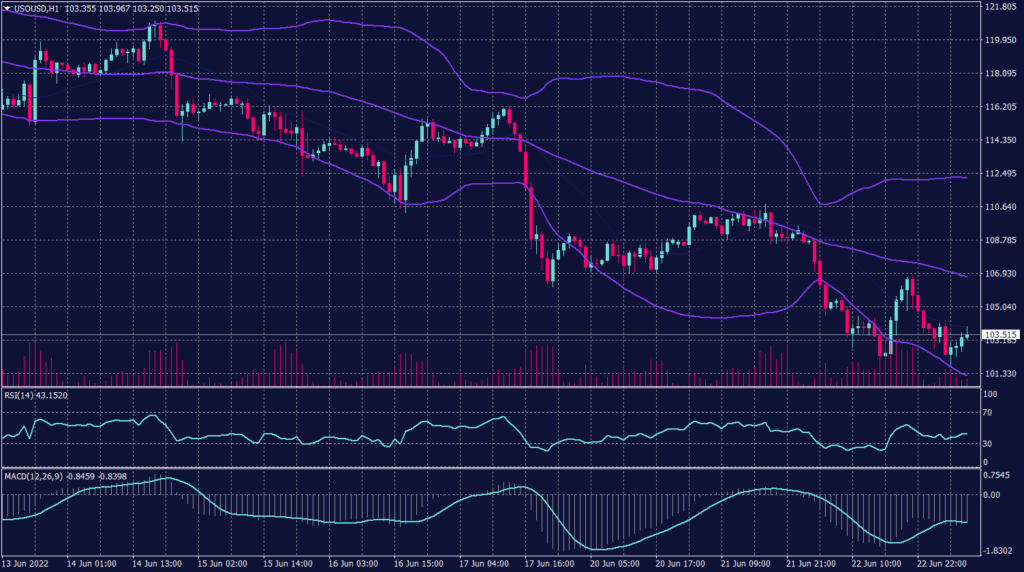
U.S. WTI futures were off lows but were down 3.7% to $104 a barrel. Similarly, Brent futures dropped 3.4% to $110.78 a barrel.
WTI prices show a continuation of the declining pattern on both hourly and daily charts and technical indicators confirm this.
On the hourly chart, WTI prices show an increase in volume traded due to the increase in supply while prices show light support near $104. Meanwhile, the daily chart confirms the decline and targets $98 a barrel after breaking the support at $106.30 yesterday.
PIVOT POINT: 104.40
| SUPPORT | RESISTANCE |
| 102.20 | 108.10 |
| 100.00 | 109.80 |
| 98.00 | 111.00 |
