

market news summary
U.S. Yields are more attractive;
USDX targets higher highs;
Crude oil targeting below $100;
Gold losses its brightness.
U.S. Dollar Index (USDX)
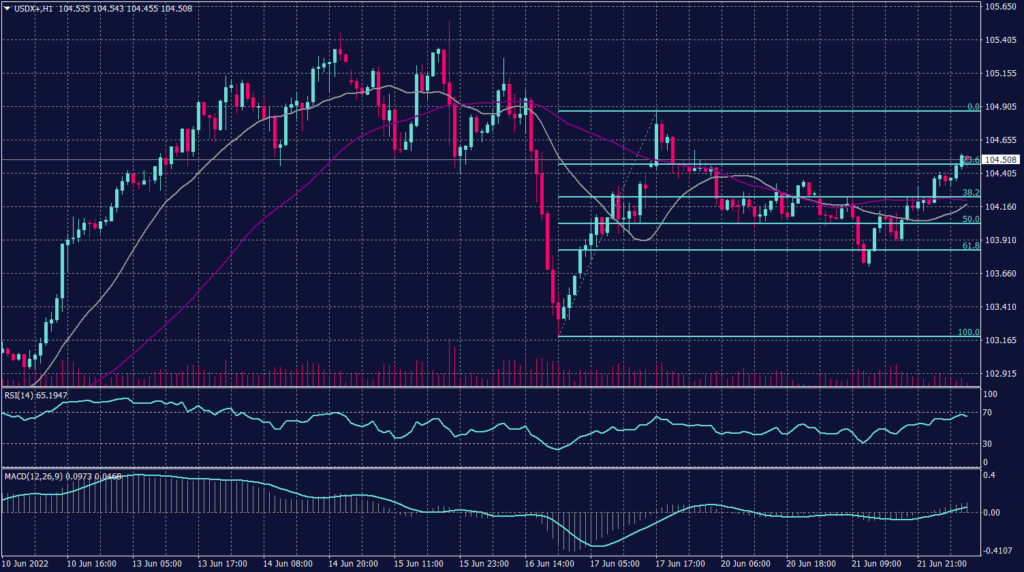
The dollar was up on Wednesday morning in Asia, investors now await cues on monetary policies from the U.S. Federal Reserve Chair’s testimonies to the Congress. The U.S. Dollar Index that tracks the greenback against a basket of other currencies edged up 0.15% to 104.377.
Technically:
The USDX traded higher today as investors are seeking safe shelter from the inflationary risks. Additionally, chart shows further increase and signals a breakout towards 105.40 under the condition of penetrating above 104.60.
PIVOT POINT: 104.40
| SUPPORT | RESISTANCE |
| 103.50 | 104.60 |
| 102.60 | 105.10 |
| 102.30 | 105.60 |
Spot Gold (XAUUSD)
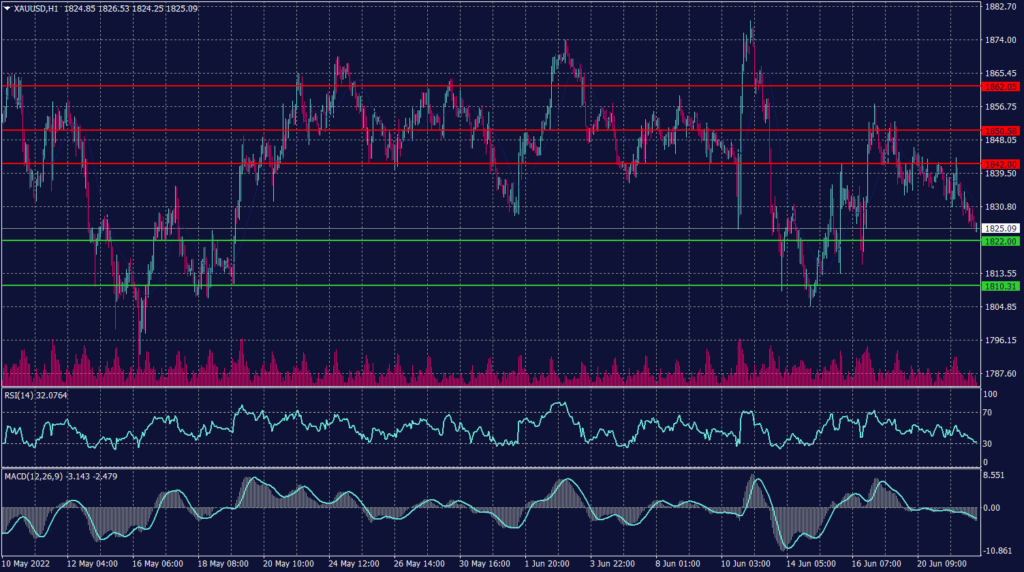
Gold was down on Wednesday morning in Asia as the U.S. dollar firmed ahead of U.S. Federal Reserve Chair’s two-day testimony where investors are expecting to seek more clues on monetary policies.
Fed Chair Jerome Powell will start a two-day testimony to Congress later in the day, with investors looking to see more clues on if the Fed will deliver another interest rate hike of 75 basis points.
Spot gold may test a support at $1,821 per ounce, with a good chance of breaking below this level and falling to $1,810.
PIVOT POINT: 1,822
| SUPPORT | RESISTANCE |
| 1,815 | 1,842 |
| 1,810 | 1,850 |
| 1,790 | 1,855 |
West Texas Crude (USOUSD)
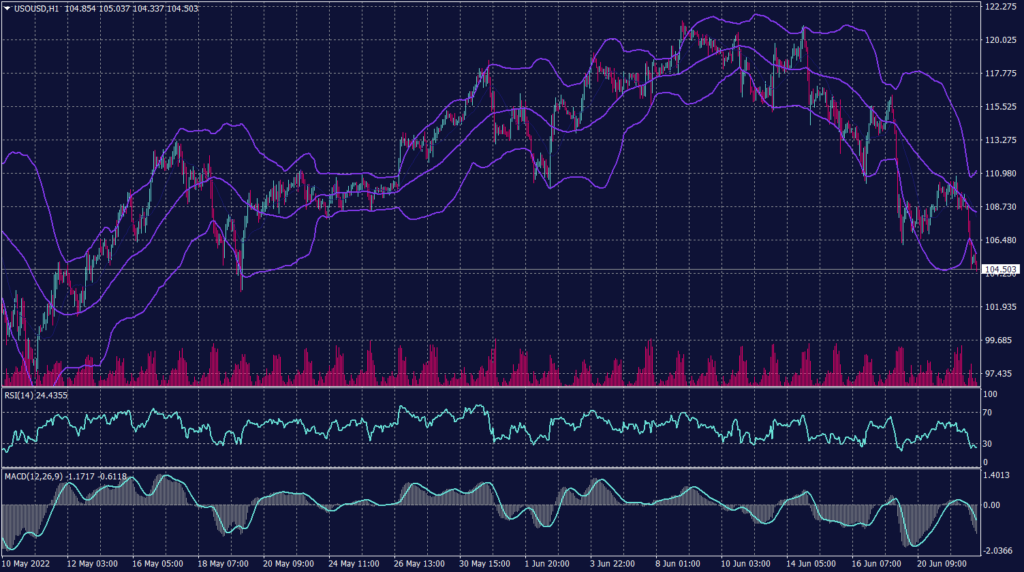
Oil prices dived more than $4 a barrel on Wednesday amid a push by U.S. President Joe Biden to bring down soaring fuel costs, including pressure on the country’s major energy firms to help ease the pain for drivers during peak summer consumption.
U.S. WTI futures were off lows but were down 3.7% to $104 a barrel. Similarly, Brent futures dropped 3.4% to $110.78 a barrel.
Technically:
WTI prices show a continuation to the declining pattern on both hourly and daily charts and technical indicators confirm.
On the hourly chart, WTI prices show an increase in volume traded due to the increase of supply while price show light support near $104. Meanwhile, the daily chart confirms the decline and targets $98 a barrel after breaking the support at $106.30 yesterday.
PIVOT POINT: 104.40
| SUPPORT | RESISTANCE |
| 102.20 | 108.10 |
| 100.00 | 109.80 |
| 98.00 | 111.00 |
