

Market News Summary
U.S dollar weakens;
Euro is consolidating;
Gold traders aim for high.
Euro (EURUSD)
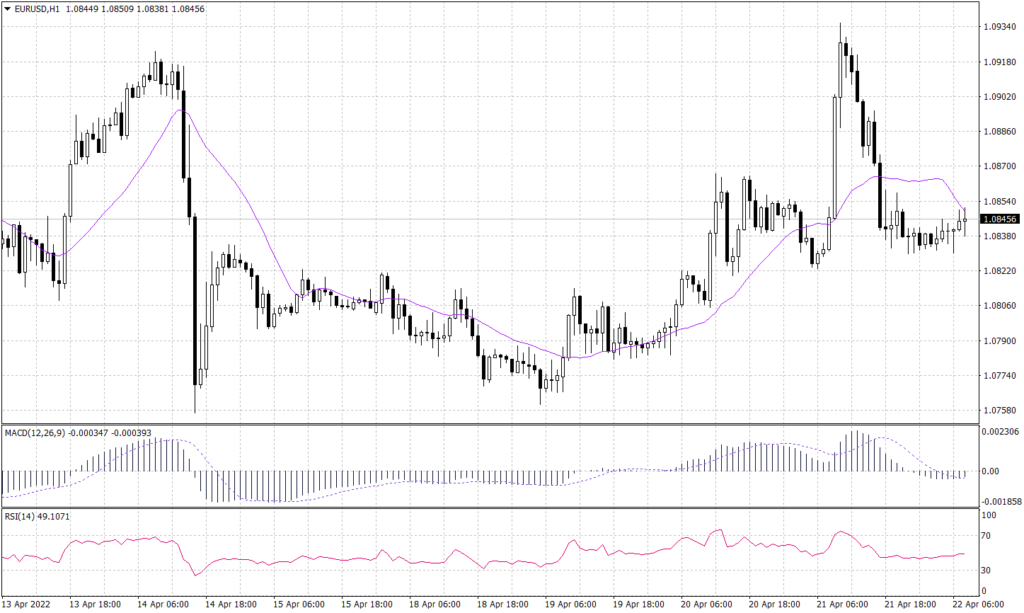
The common currency retreated after comments by the Fed chairman regarding the monetary policy yesterday. However, EURUSD was traded heavily above the support at 1.0840 and started to show hopes awaiting Lagarde’s speech later today. Technically, the pair remains in a downward trend over the long run as shown in the daily chart. Moreover, the current level is critical to deciding the next impulsive movement. Meanwhile, the intraday charts show a horizontal and cautious movement. Technical indicators RSI and MACD appear indecisive.
PIVOT POINT: 1.0840
| R1 | R2 | R3 | |
| RESISTANCE | 1.0865 | 1.0880 | 1.0895 |
| S1 | S2 | S3 | |
| SUPPORT | 1.0820 | 1.0805 | 1.0790 |
Bitcoin (BTCUSD)
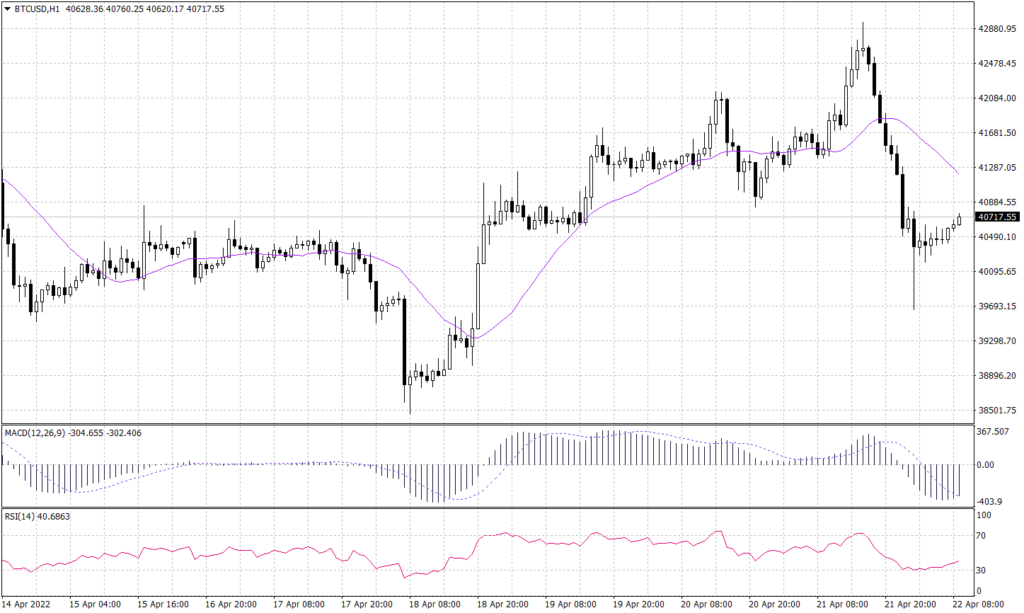
Bitcoin appears to form a bearish flag on the hourly chart, which might give BTCUSD a slight advance during the day before returning to the primary downward trend. With the 20-period moving average above price, price appears to have broken the upward trend-line and previous lows to confirm the downward move of the hourly chart. The RSI and MACD both confirm the price’s downward trend.
PIVOT POINT: 40,655
| R1 | R2 | R3 | |
| RESISTANCE | 40,945 | 41,315 | 41,760 |
| S1 | S2 | S3 | |
| SUPPORT | 40,395 | 39,840 | 39,500 |
Swiss Franc (USDCHF)
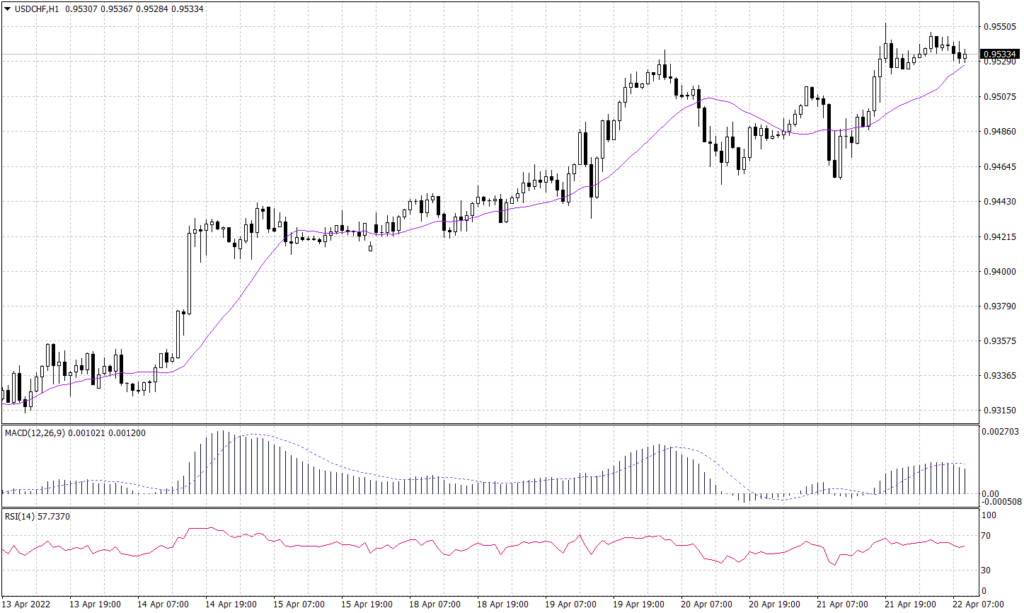
The daily chart of the USDCHF shows an overall bullish trend. Similarly, the hourly chart shows an uptrend with the 20 candle MA going below the price. As the price appears to have broken above the previous highs, the MACD and RSI both signal a bullish continuation.
PIVOT POINT: 0.9530
| R1 | R2 | R3 | |
| RESISTANCE | 0.9555 | 0.9580 | 0.9610 |
| S1 | S2 | S3 | |
| SUPPORT | 0.9510 | 0.9490 | 0.9455 |
Canadian Dollar (USDCAD)
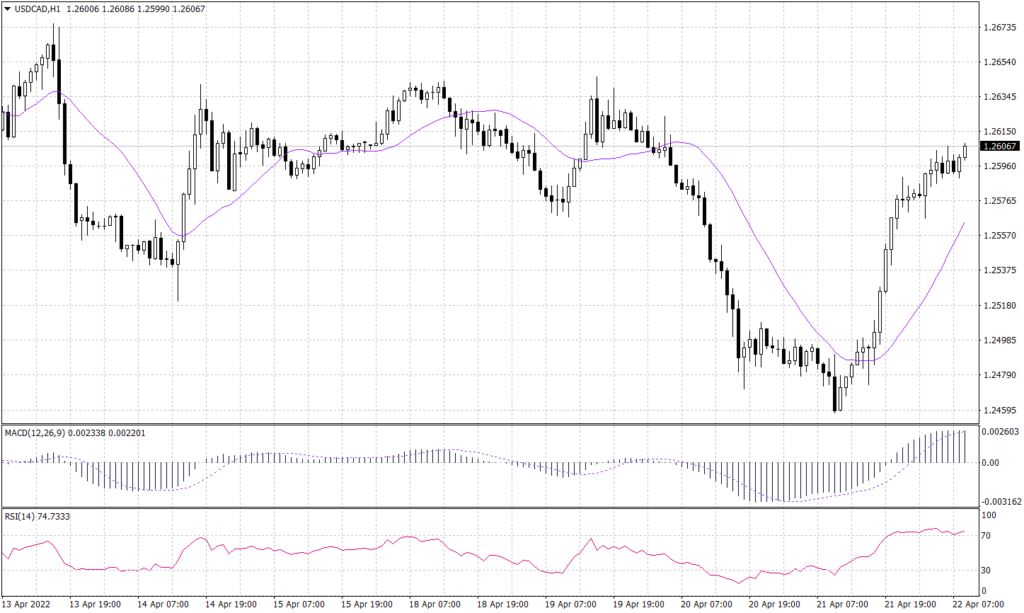
Price appears to be trending horizontally on the USDCAD daily chart. The hourly chart also shows the horizontal price change. Even though the MACD indicates that the price is about to reverse to the downside at the level of 1.2600, the RSI indicates that the market is overbought.
PIVOT POINT: 1.2600
| R1 | R2 | R3 | |
| RESISTANCE | 1.2620 | 1.2645 | 1.2675 |
| S1 | S2 | S3 | |
| SUPPORT | 1.2570 | 1.2540 | 1.2510 |
FTSE 100 (UK100)
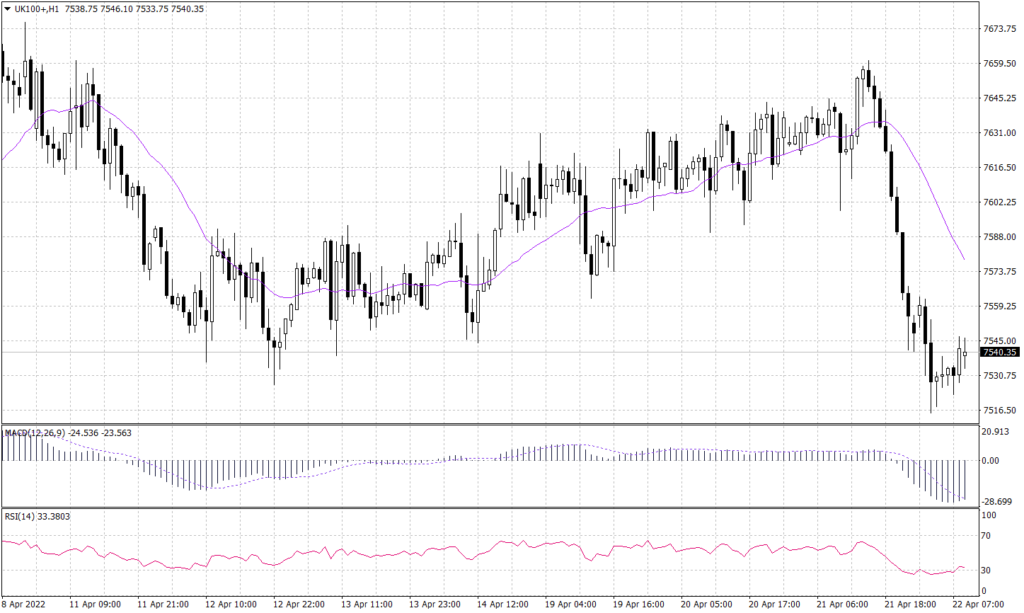
Overall, the FTSE100 is trending upwards. On the hourly chart, however, the index value appears to have broken through the upward trendline and several lows to reach the resistance level of 7,520. The RSI is oversold, and the MACD is showing a likely price turnaround before a further drop.
PIVOT POINT: 7,545
| R1 | R2 | R3 | |
| RESISTANCE | 7,560 | 7,590 | 7,610 |
| S1 | S2 | S3 | |
| SUPPORT | 7,520 | 7,500 | 7,485 |
Spot Gold (XAUUSD)
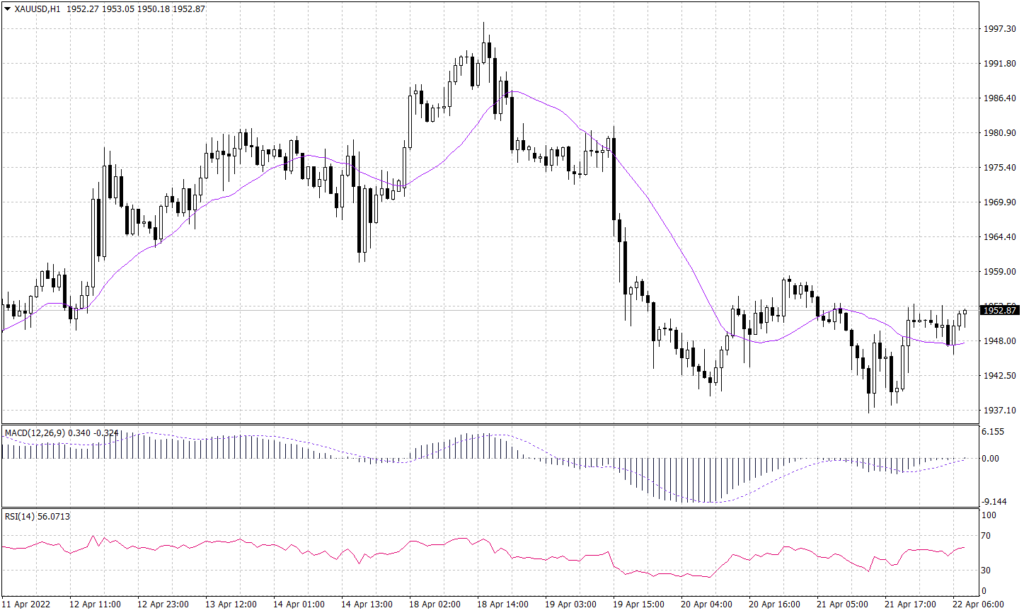
Gold prices are trading below the resistance of $1,950 and keep an optimistic view. The hourly chart, on the other hand, displays a horizontal price movement as the 20-period moving average moves in-between prices. The RSI and MACD both show a horizontal movement, indicating that the price is undecided about its direction.
PIVOT POINT; 1,950
| R1 | R2 | R3 | |
| RESISTANCE | 1,960 | 1,965 | 1,970 |
| S1 | S2 | S3 | |
| SUPPORT | 1,945 | 1,940 | 1,935 |
