

U.S. Dollar Index (USDX)
The greenback moves in a slow upward fashion maintaining the overall positive outlook. However, market participants are taking extra caution prior to the European interest rate decision.
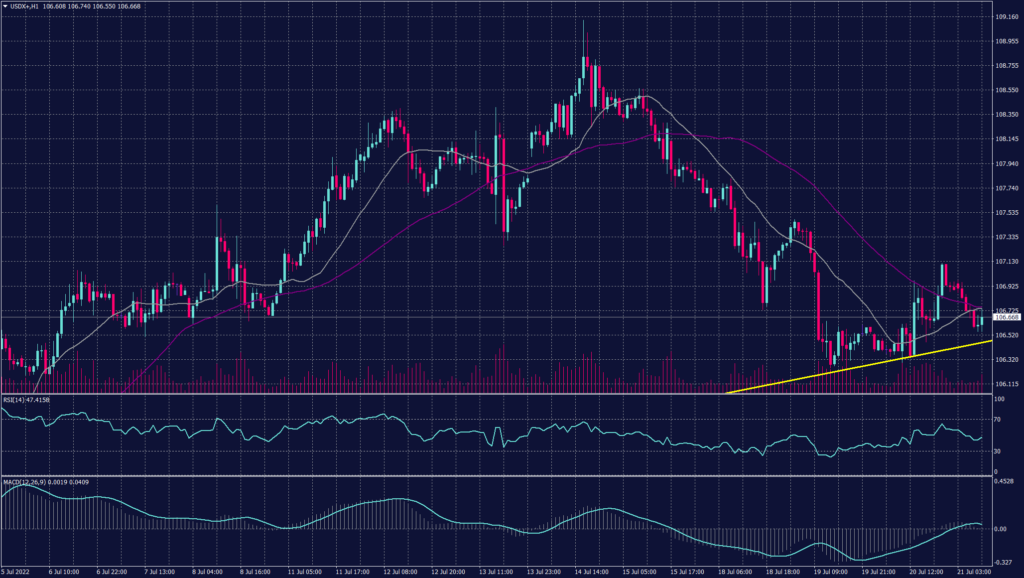
The U.S. dollar index fluctuated between red and green during the early sessions, but it remains positive on the daily chart. However, the hourly chart shows tension between 106.50 and 106.80. The trading momentum was offset as fears of recession rise.
On the hourly chart, technical indicators show a possibility of continuation to the downtrend as RSI is heading to 30 and MACD shows a possible decline.
PIVOT POINT: 106.75
| SUPPORT | RESISTANCE |
| 106.50 | 106.85 |
| 106.40 | 107.40 |
| 106.20 | 107.70 |
Euro (EURUSD)
The euro rallied during the early trades rising back toward a two-week high against the greenback, as Russian gas began to flow through a key pipeline again, but investors were cautious ahead of an expected European Central Bank interest rate hike later in the day. The common currency gained for three sessions amid expectations the ECB might deliver 50 basis-point (bps) rate.
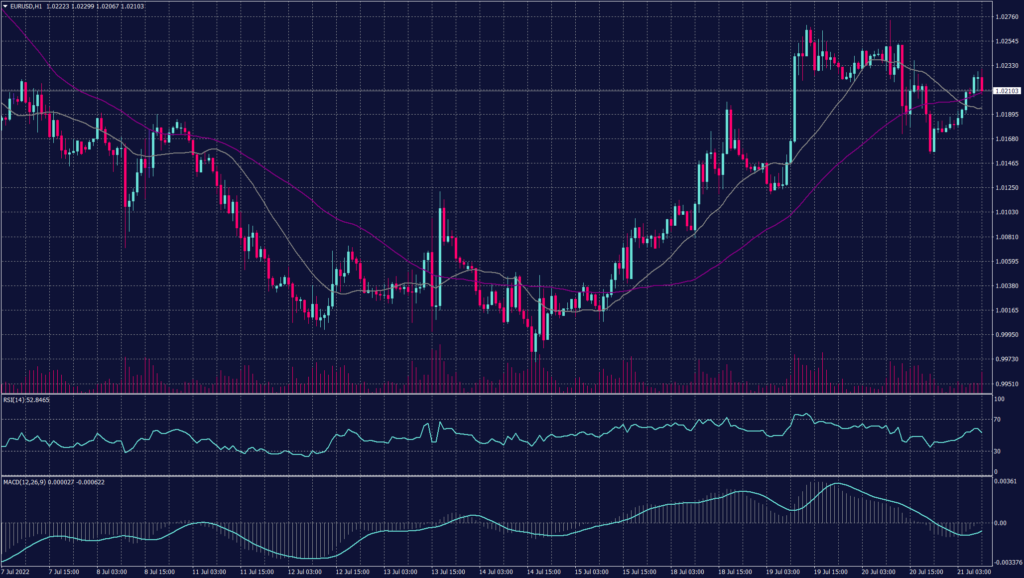
The euro gained 0.42% to $1.02215, clawing back most of its sizeable retreat from Wednesday, when it hit an intraday peak of $1.0273, the highest since July 6. Meanwhile, the hourly chart reflects a corrective movement in a long secondary trend targeting 1.0260 as the next resistance. However, the daily chart remains to hold the negative trend aiming towards 0.9960.
PIVOT POINT: 1.0230
| SUPPORT | RESISTANCE |
| 1.0100 | 1.0270 |
| 0.9960 | 1.0350 |
| 0.9850 | 1.0470 |
Spot Gold (XAUUSD)
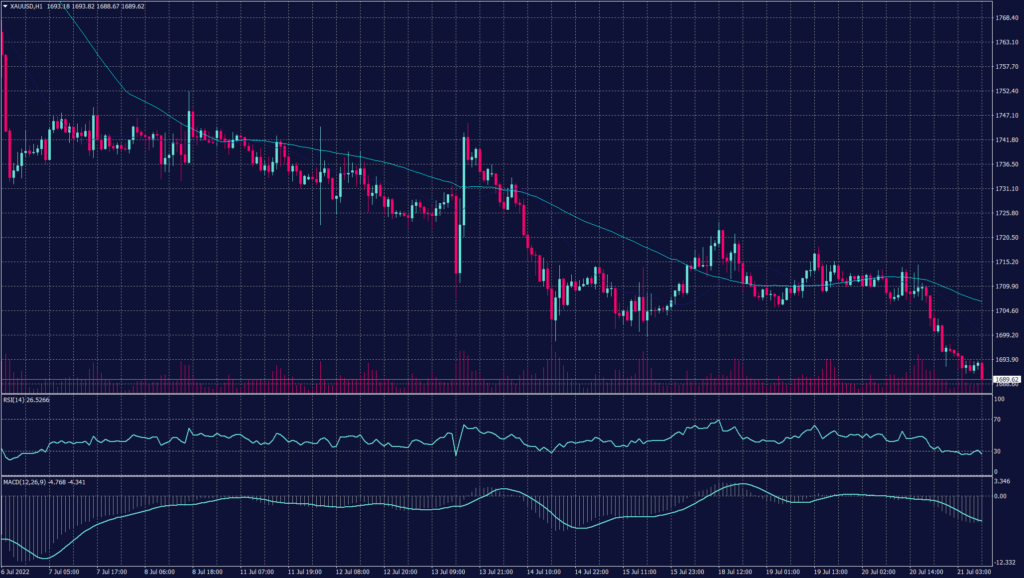
The precious metal shed $9 per ounce trading at $1,685 per ounce as traders prefer yield generating investments. Gold prices dropped below the $1,700 barrier after losing the support amid inflation figures as market experts anticipate a 100 bp rate hike during the next Fed meeting.
Gold traded below the support at $1,700 per ounce this morning in Asia and shows a possibility to hit 1,680. The daily chart, however, shows a continuation of the negative and a possibility to break the 11-months low below $1,675 per ounce.
PIVOT POINT: 1,685
| SUPPORT | RESISTANCE |
| 1,680 | 1,700 |
| 1,675 | 1,705 |
| 1,672 | 1,710 |
West Texas Crude (USOUSD)
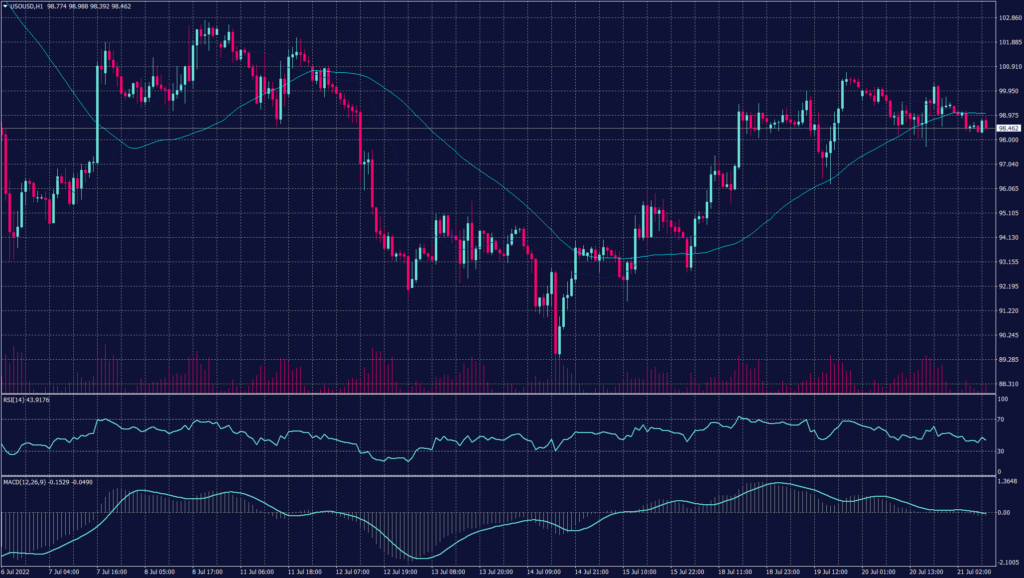
Oil declined as investors assessed signs of declining demand in the U.S. and growth in stockpiles. West Texas Intermediate fell below $99 a barrel after losing about 1% on Wednesday. A U.S. report showed stockpiles of the fuel rose more than expected last week, while a four-week average indicated high prices crimped use to just above the same time two years ago, and below every other year since 2000.
Crude oil is falling for the second day after as traders weigh the impact on demand from a potential recession, as well as a broad appetite for risk and wider market moves.
On the hourly chart, the prices show a tendency to decline as the resistance is strengthening below $99 a barrel. Meanwhile, technical indicators confirm a possibility of a drop towards $93.70 a barrel.
PIVOT POINT: 96.60
| SUPPORT | RESISTANCE |
| 96.00 | 99.00 |
| 94.00 | 101.00 |
| 92.20 | 102.10 |
