

Market News Summary
EURUSD revers losses;
WTI awaits the inventories;
Gold in a narrow range.
Euro (EURUSD)
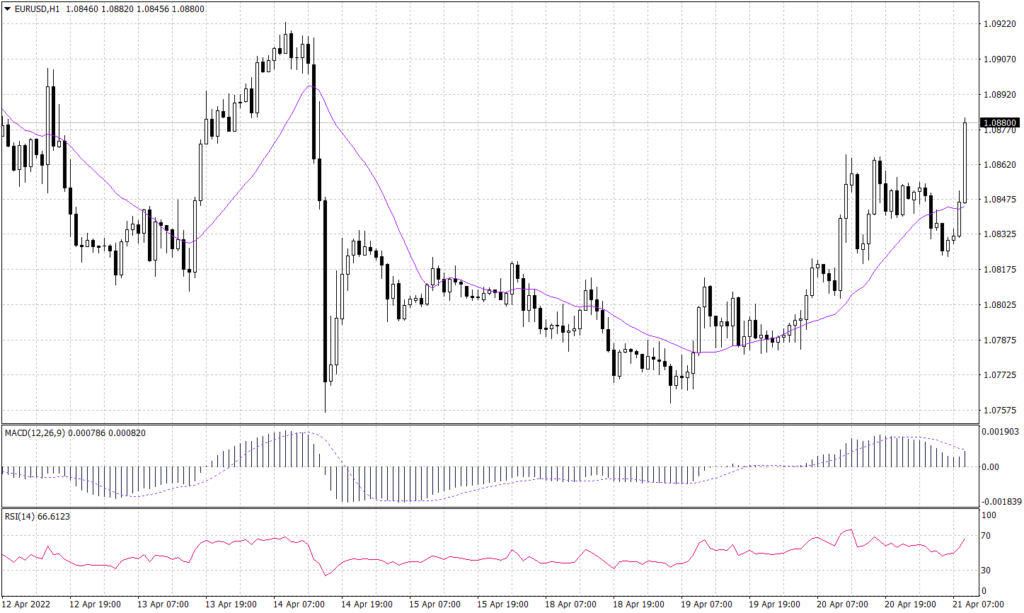
The European currency traded up for the third day, although it retains the negative trend on the daily chart. The common currency bounced from the support at 1.0780 earlier this week, which revers some of the losses recorded before the Good Friday holiday. EURUSD traded up with the European session. Technically, the hourly chart shows an impulsive movement that exceeded the moving average line, which signals a downward reversal. Technical indicators RSI and MACD show an unsustainable upward trend.
PIVOT POINT: 1.0855
| R1 | R2 | R3 | |
| RESISTANCE | 1.0865 | 1.0880 | 1.0895 |
| S1 | S2 | S3 | |
| SUPPORT | 1.0840 | 1.0820 | 1.0805 |
Dow Jones (US30)
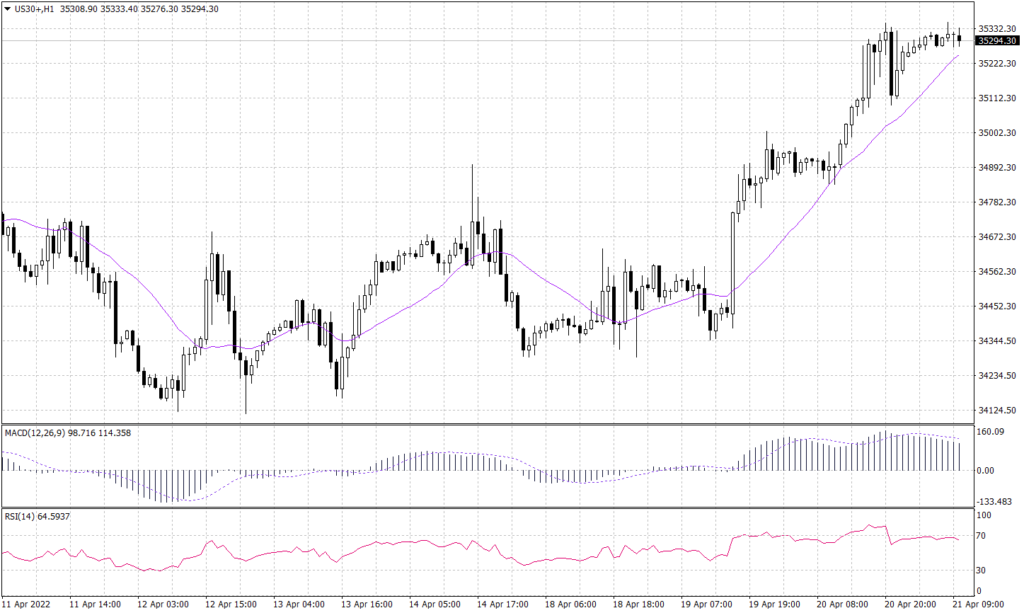
As the price rallied off the last support level of 34,130, the Dow Jones daily trend shows an upward trend. Similarly, the hourly chart shows that the value is making new highs and has reached the highest level since March 30th. RSI is showing the DJ30 is bought supported by the resistance level formed below 34,350. Meanwhile, MACD shows a slowdown in the uptrend momentum without abandoning the upward trend.
PIVOT POINT: 35,345
| R1 | R2 | R3 | |
| RESISTANCE | 35,440 | 35,585 | 35,705 |
| S1 | S2 | S3 | |
| SUPPORT | 35,250 | 35,175 | 35,080 |
Sterling Pounds (GBPUSD)
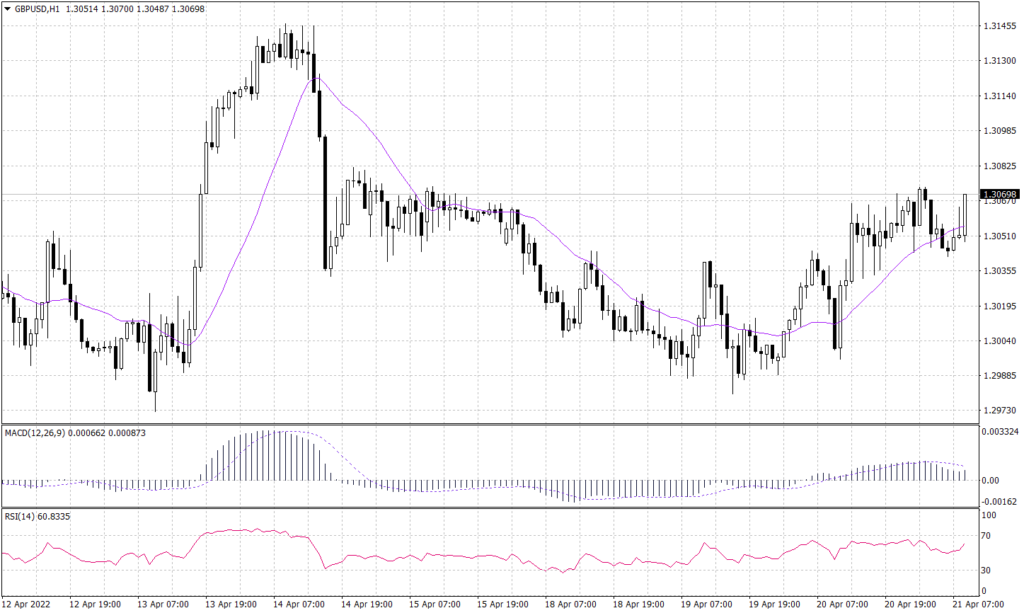
On the daily chart, the Cable trend remains gloomy. However, the pair is moving in a bullish direction, as higher highs are made, and the upward trend line is maintained in the short term. Furthermore, the hourly chart’s RSI and MACD technical indicators show a bullish continuation.
PIVOT POINT: 1.3055
| R1 | R2 | R3 | |
| RESISTANCE | 1.3070 | 1.3090 | 1.3110 |
| S1 | S2 | S3 | |
| SUPPORT | 1.3045 | 1.3030 | 1.3015 |
Spot Gold (XAUUSD)
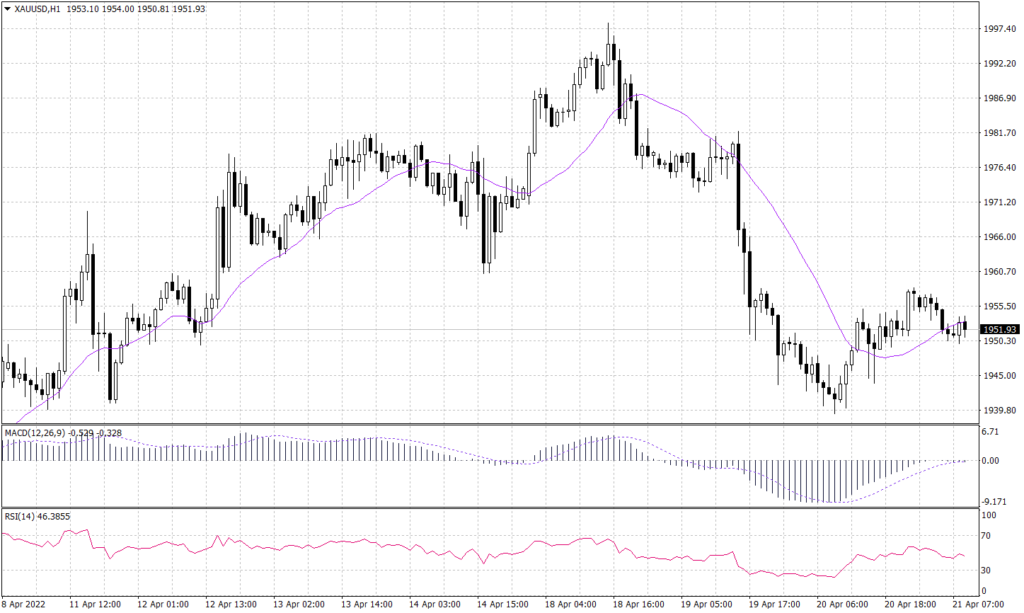
Spot Gold’s daily chart outlook stays optimistic. On the other hand, the hourly chart shows that price has formed a corrective channel toward the resistance level of $1,960 an ounce before retreating to $1,940. The technical indicators RSI and MACD are indecisive about the price trend since the price can break above or below the corrective channel.
PIVOT POINT: 1,950
| R1 | R2 | R3 | |
| RESISTANCE | 1,960 | 1,965 | 1,970 |
| S1 | S2 | S3 | |
| SUPPORT | 1,940 | 1,935 | 1,930 |
Spot WTI (USOUSD)
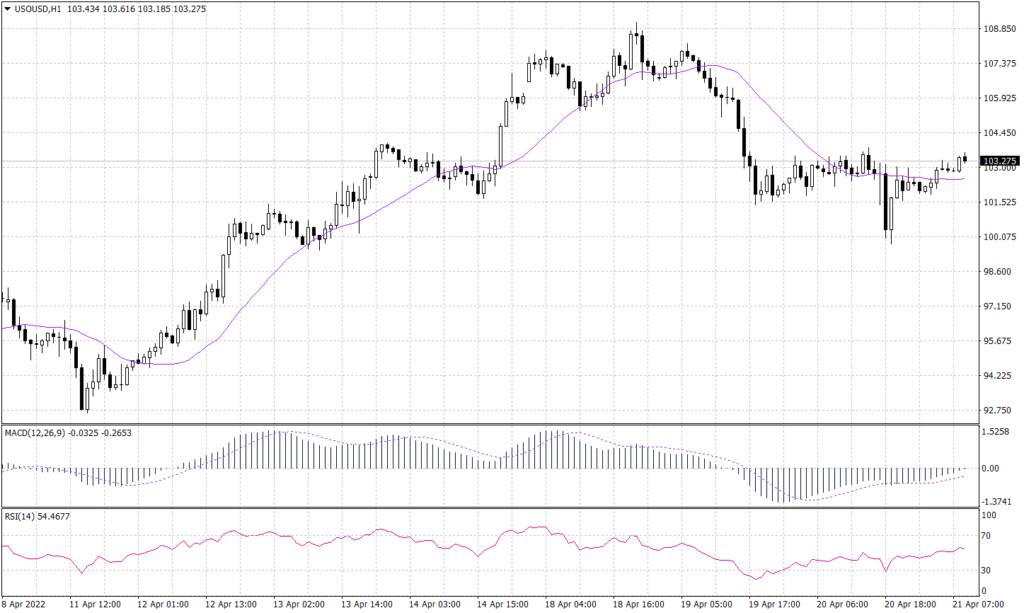
Crude oil price movements are more fundamental than technical for the time being. Price continues to move horizontally on the daily chart, with the 20 periods moving average moving in-between prices. Furthermore, the hourly chart appears bearish, as the price made a new bottom before bouncing to the level of 103.95. In addition, the RSI and MACD reveal an indecisive price trend.
PIVOT POINT: 103.95
| R1 | R2 | R3 | |
| RESISTANCE | 105.30 | 106.70 | 108.10 |
| S1 | S2 | S3 | |
| SUPPORT | 101.80 | 99.70 | 98.20 |
