

Market News Summary
The Sterling pound is gaining ground;
WTI traders should wait for inventories;
Gold is retreating under selling pressure;
Bitcoin gains as a safe investment.
Euro Sterling (EURGBP)
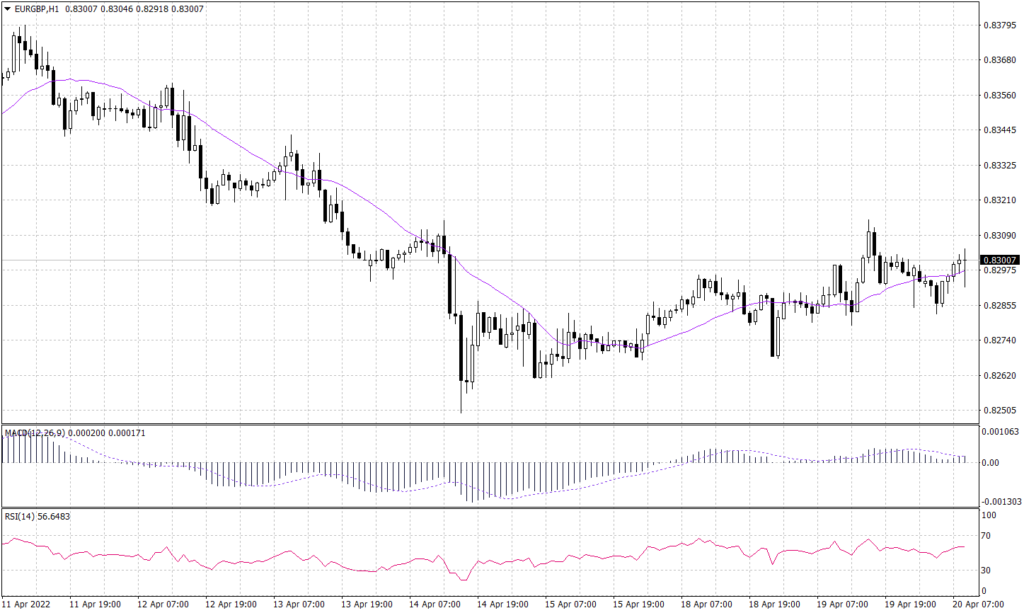
The Sterling pound outweighs the common currency driving the daily chart into a downtrend. The trend appears to make a corrective pullback on the hourly chart, drawing higher highs and reaching 0.8310. Based on the price action, it appears that the pair may resume its downward movement after touching the resistance near 0.8310. As the pair is moving in a tight range, thus the MACD and RSI look to be indecisive.
PIVOT POINT: 0.8300
| R1 | R2 | R3 | |
| RESISTANCE | 0.8310 | 0.8320 | 0.8330 |
| S1 | S2 | S3 | |
| SUPPORT | 0.8285 | 0.8270 | 0.8260 |
Spot WTI (USOUSD)
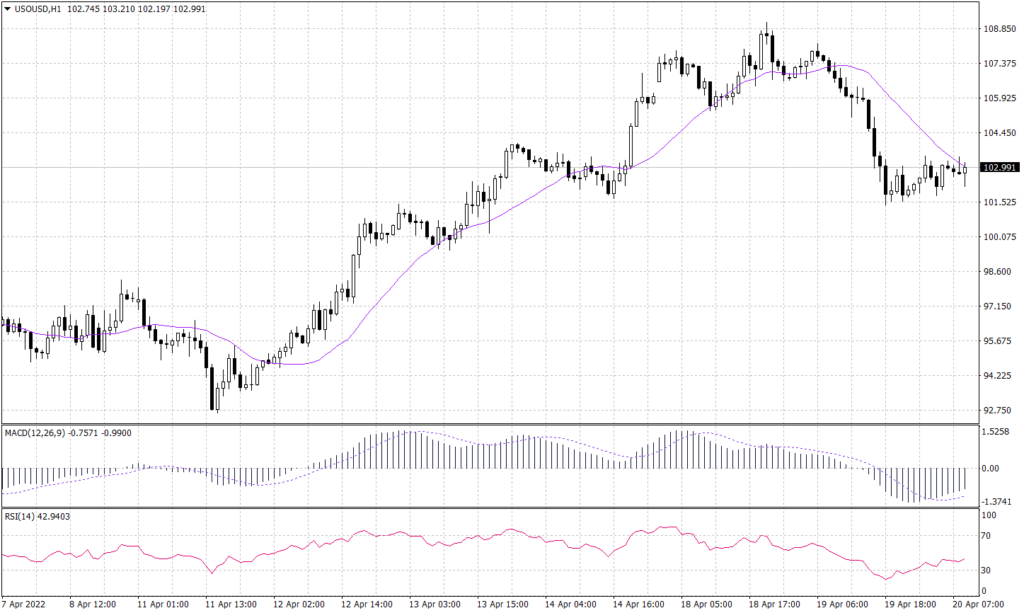
WTI’s daily chart indicates a high buying pressure below $103.95 a barrel. Nevertheless, the bullish pressure seems to be not enough to break above that level during the Asian session. Technically, there is no signal of an impulsive gain or drastic drop before the U.S. session. RSI and MACD show high buying pressure but can’t tell where the trend line will go. On the other hand, the hourly chart shows a shift in price bias to the negative as the price pulls back to the level of $103.95, which intersects the 20-period moving average.
PIVOT POINT: 103.95
| R1 | R2 | R3 | |
| RESISTANCE | 105.30 | 106.65 | 108.20 |
| S1 | S2 | S3 | |
| SUPPORT | 101.55 | 99.40 | 97.40 |
Sterling Pound (GBPUSD)
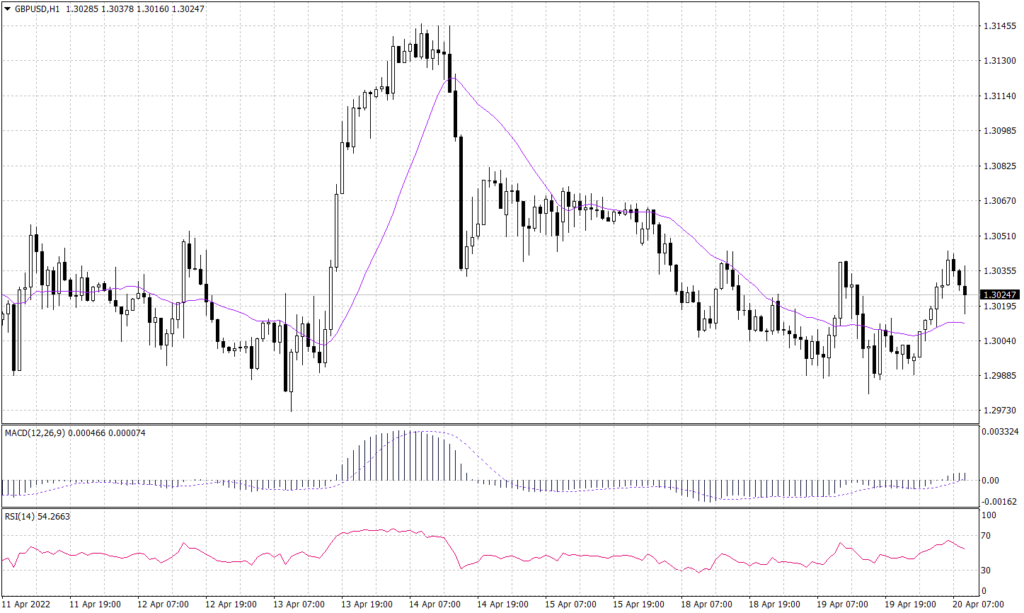
The Cable remains within its bearish downtrend channel mentioned previously. conversely, in the intraday charts, the Sterling pound continues to trade slightly higher. Additionally, GBPUSD has established support above 1.2990 shown in a double bottom formation. Meanwhile, Technical indicators show a likelihood of an uptrend continuation.
PIVOT POINT: 1.3045
| R1 | R2 | R3 | |
| RESISTANCE | 1.3060 | 1.3075 | 1.3090 |
| S1 | S2 | S3 | |
| SUPPORT | 1.3030 | 1.3015 | 1.2990 |
Bitcoin (BTCUSD)
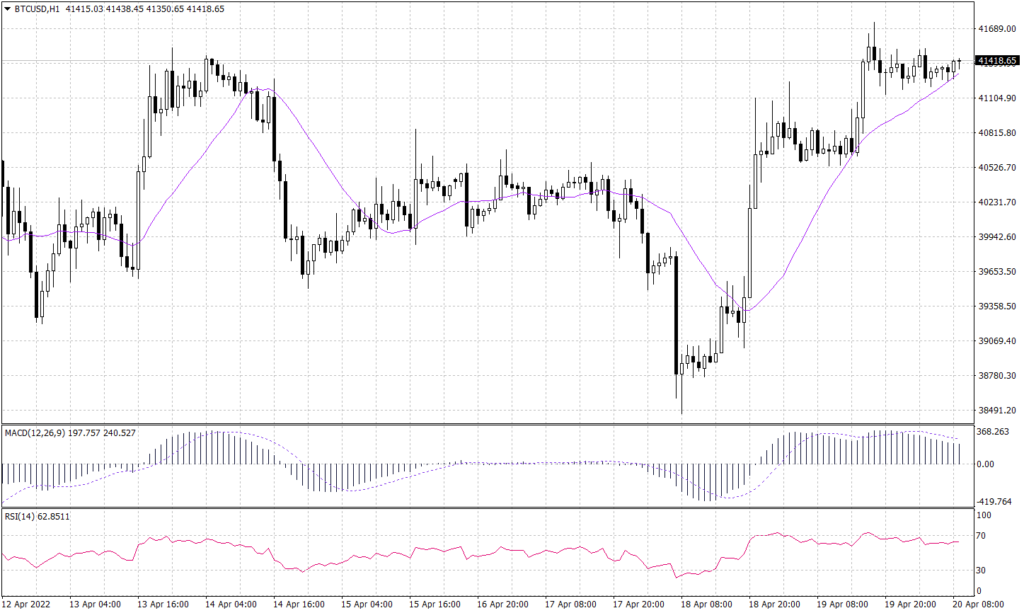
The Bitcoin bounced from its long-term support above $39,600 reaching the heavy resistance below 41,400. Similarly, the hourly chart shows a shift to the upside, with price testing the resistance around 41,400. The hourly chart shows a bullish formation at $41,230, intersecting the 20-candle moving average. The RSI and MACD both show an upward continuation.
PIVOT POINT: 41,230
| R1 | R2 | R3 | |
| RESISTANCE | 41,760 | 42,240 | 42,790 |
| S1 | S2 | S3 | |
| SUPPORT | 40,945 | 40,655 | 40,395 |
Spot Gold (XAUUSD)
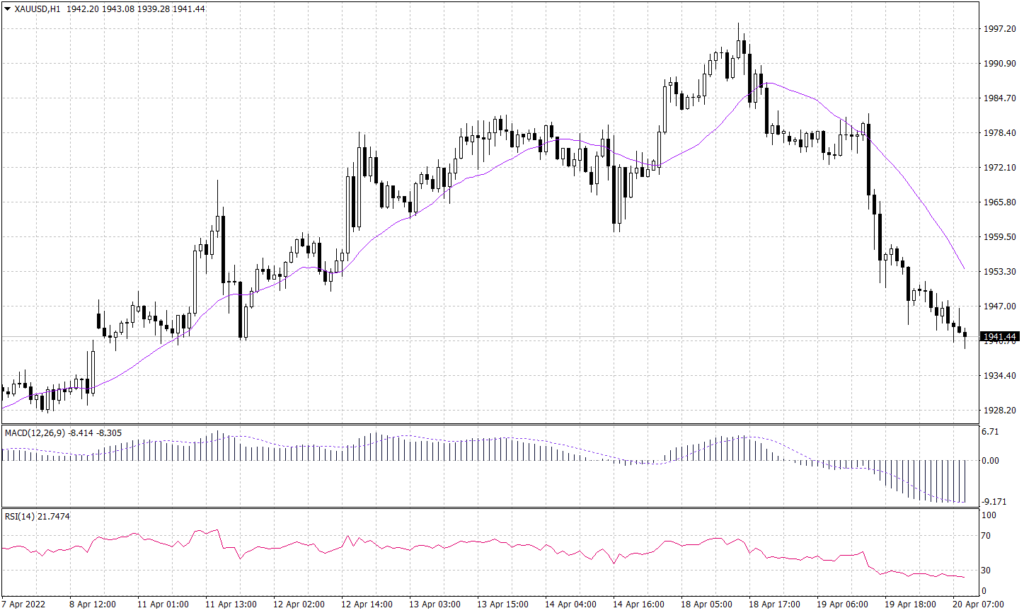
Spot Gold trades lower for the second day reaching $1,940 and targeting the fail-safe level of $1,920. However, the precious metal has broken outside the upward channel and formed a bearish trend during the Asian session. The RSI currently shows the gold is oversold, indicating a likely pullback towards $1,950, which may intersect the 20 period MA to indicate a further drop towards $1,920.
PIVOT POINT: 1,940
| R1 | R2 | R3 | |
| RESISTANCE | 1,950 | 1,960 | 1,965 |
| S1 | S2 | S3 | |
| SUPPORT | 1,935 | 1,930 | 1,920 |
