

Market News Summary
Dow Jones towards 34,200, while Euro is losing slowly. Gold traders aim for high and USDJPY is on Rocket fly.
Dow Jones 30 (US30)
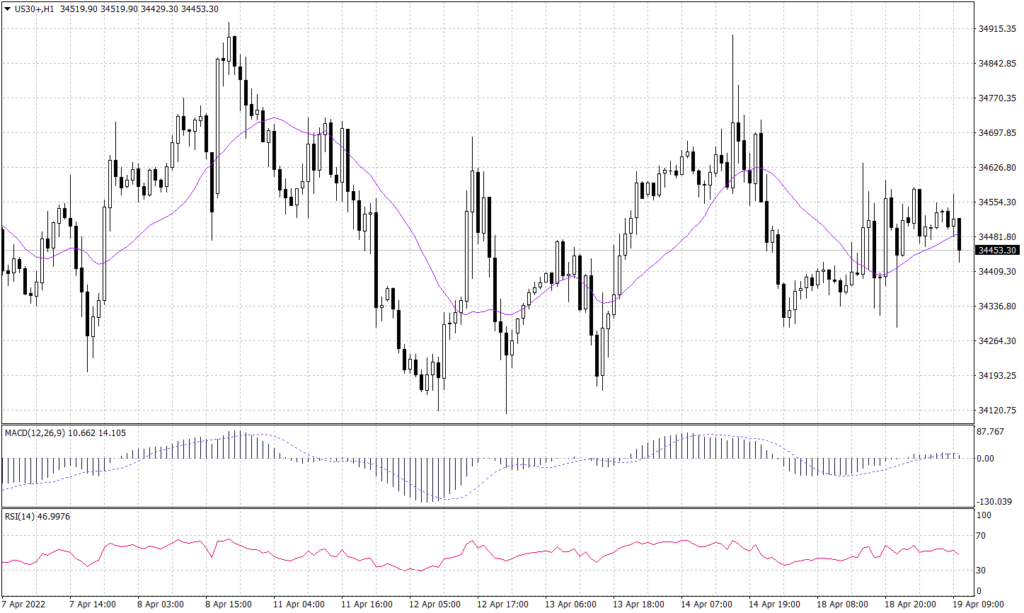
U.S. equities blue-chip traded under heavy selling pressure during the Asian trades. However, the Dow Jones lost over 100 points during the first 30 minutes of the European session. Technically, DJ30 (US30) broke below the support of 34,480 and is falling towards the support at 34,410. Meanwhile, technical indicators show a high probability of a further fall below 34,200.
PIVOT POINT: 34,480
| S1 | S2 | S3 | |
| SUPPORT | 34,410 | 34,330 | 34,200 |
| R1 | R2 | R3 | |
| RESISTANCE | 34,530 | 34,580 | 34,720 |
Euro (EURUSD)
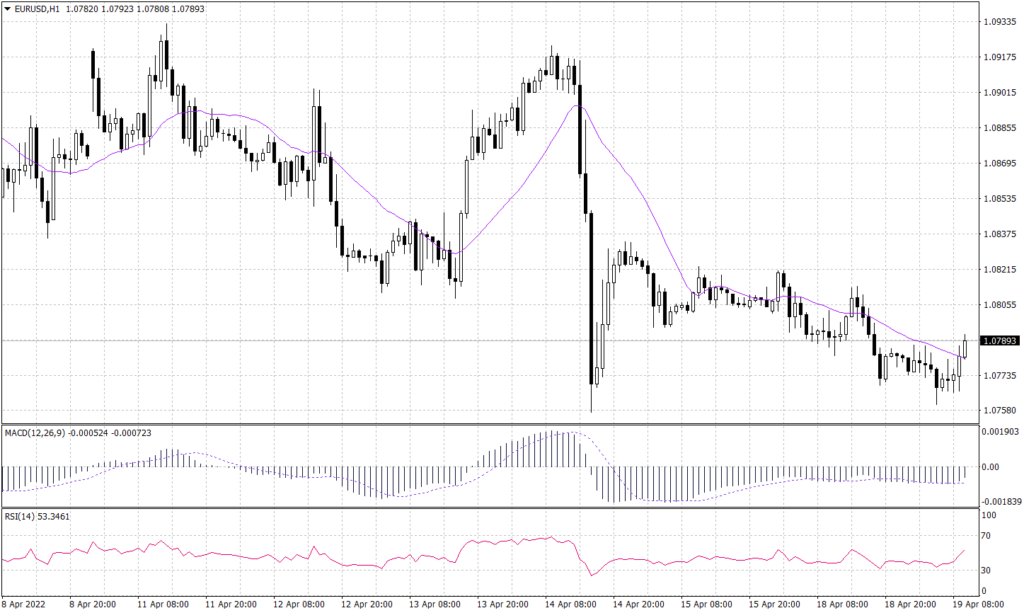
The Euro traded a little higher during the Asian trades. However, the common currency remains moving within a downward channel created from the horizontal movement for the last couple of sessions. Technically, the EURUSD pair remains on a downtrend, although the slope is not steep. Technical indicators show further decline targeting 1.0750.
PIVOT POINT: 1.0800
| S1 | S2 | S3 | |
| SUPPORT | 1.0775 | 1.0750 | 1.0600 |
| R1 | R2 | R3 | |
| RESISTANCE | 1.0830 | 1.0855 | 1.1080 |
Japanese Yen (USDJPY)
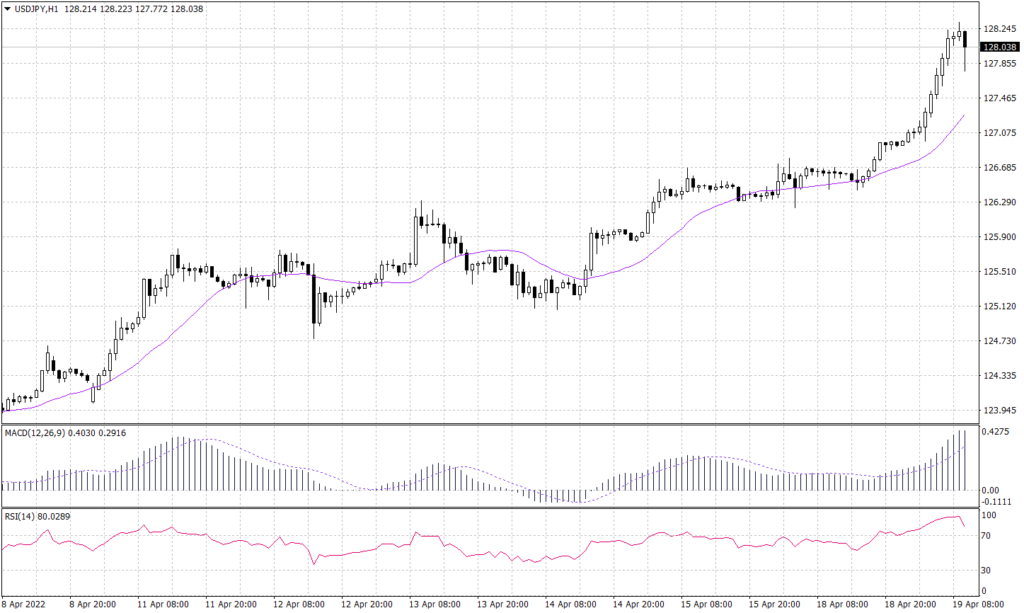
The Japanese hit a new all-time low against the greenback touching 128.318. The USDJPY pair remains bullish and indicates further advancement towards 132. However, the pair faced a light resistance at 128 and bounced below it during the early European trades. MACD shows further advancement, while the RSI indicates a corrective movement before the continuation.
PIVOT POINT: 128.00
| S1 | S2 | S3 | |
| SUPPORT | 127.85 | 127.10 | 126.30 |
| R1 | R2 | R3 | |
| RESISTANCE | 128.25 | 129.10 | 129.60 |
Spot Gold (XAUUSD)
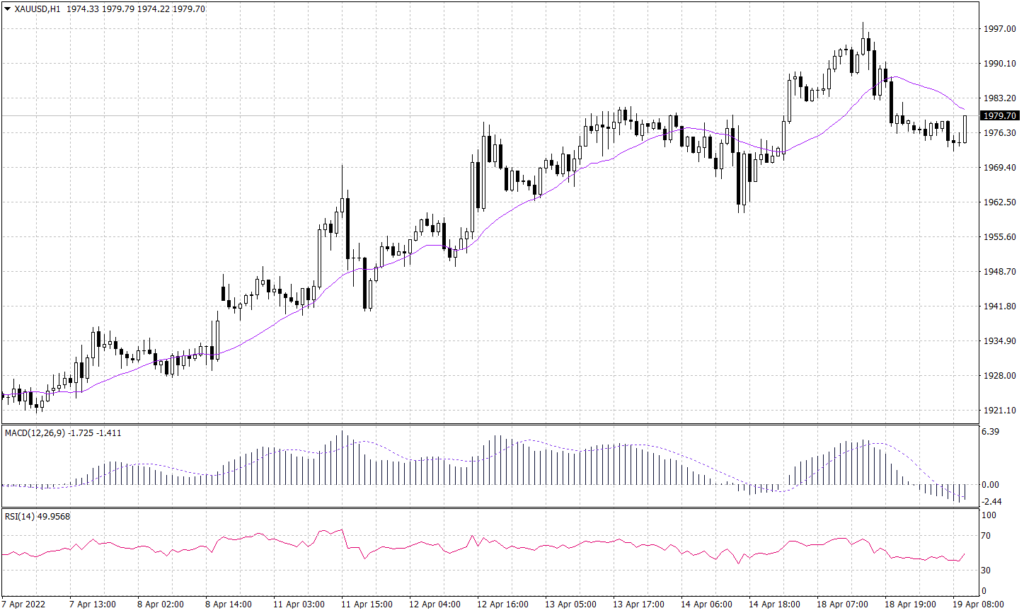
The precious metal declines to the range above $1,980 per ounce after touching near $2,000. The precious metal is seen recording a new all-time high if the bulls pressure the price above $2,000. Furthermore, technical indicators support the theory of hitting a new all-time high and show signals for further advancement towards $2,100 per ounce.
PIVOT POINT: 1,980
| S1 | S2 | S3 | |
| SUPPORT | 1,995 | 2,000 | 2,010 |
| R1 | R2 | R3 | |
| RESISTANCE | 1,977 | 1,970 | 1,965 |
