

Market News Summary
U.S. dollar index (USDX)
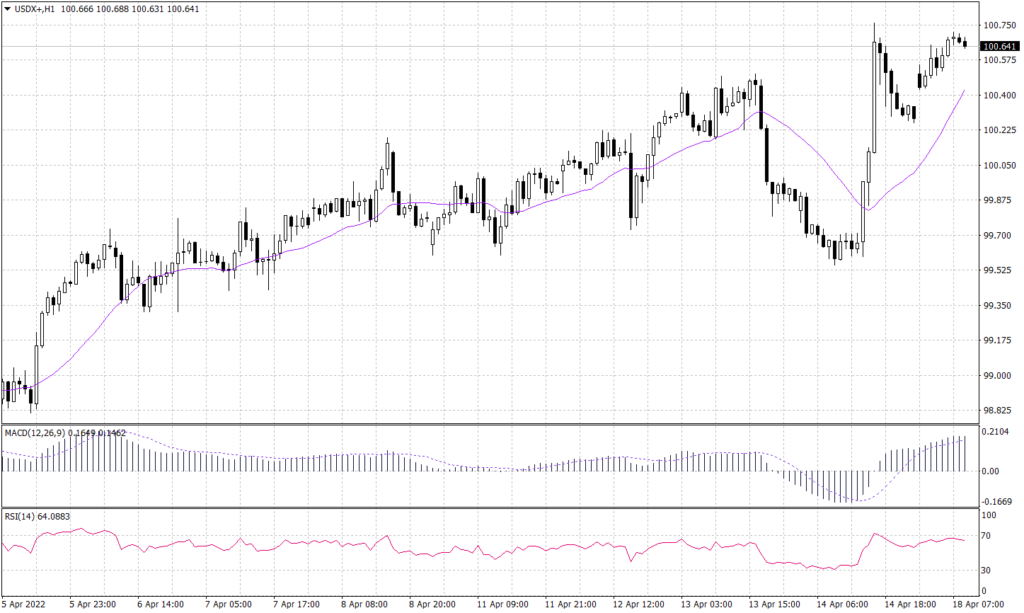
The U.S. dollar index traded up near 100.68 boosted by better-than-expected manufacturing data. However. The index remains strongly supported above 100.25 and heading up towards the resistance level of 100.75. Technical indicators show a slight fluctuation before during the day but remain to signal an advance towards 100.75.
PIVOT POINT: 100.55
| S1 | S2 | S3 | |
| SUPPORT | 100.25 | 100.10 | 99.70 |
| R1 | R2 | R3 | |
| RESISTANCE | 100.65 | 100.75 | 101.10 |
Euro (EURUSD)
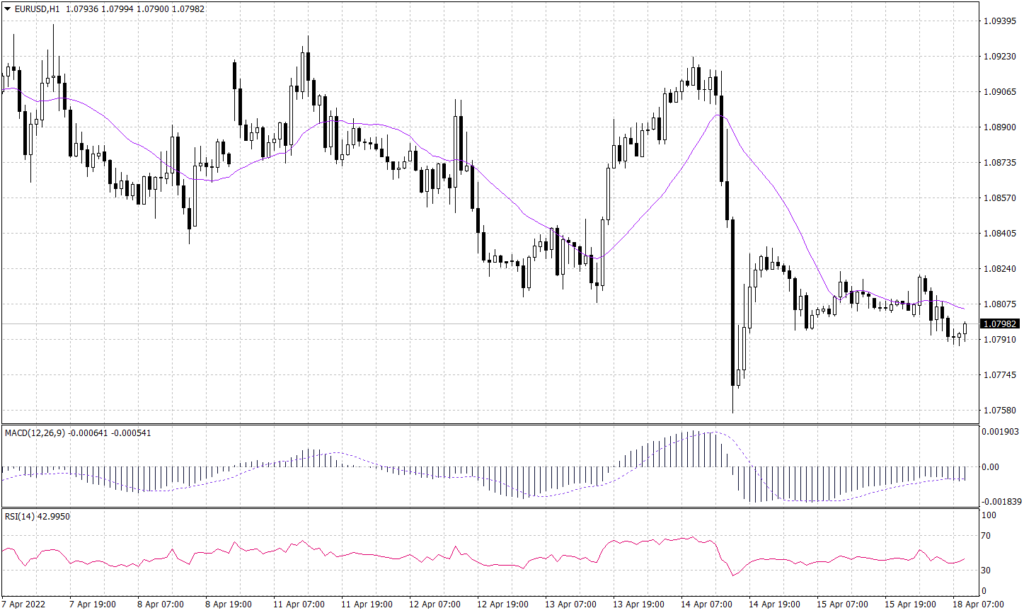
The Euro traded lower during the Asian trades as the U.S. dollar is strengthening. The common currency is forming a horizontal channel between 1.0790 and 1.0810 in the short-term time frames. Technically, the EURUSD pair remains inside the downward long-term channel, and it is not showing any signs of breaking out anytime soon. Technical indicators are moving horizontally on the daily chart while signaling a further drop in the daily time frame.
PIVOT POINT: 1.0800
| S1 | S2 | S3 | |
| SUPPORT | 1.0775 | 1.0750 | 1.0600 |
| R1 | R2 | R3 | |
| RESISTANCE | 1.0830 | 1.0855 | 1.1080 |
Japanese Yen (USDJPY)
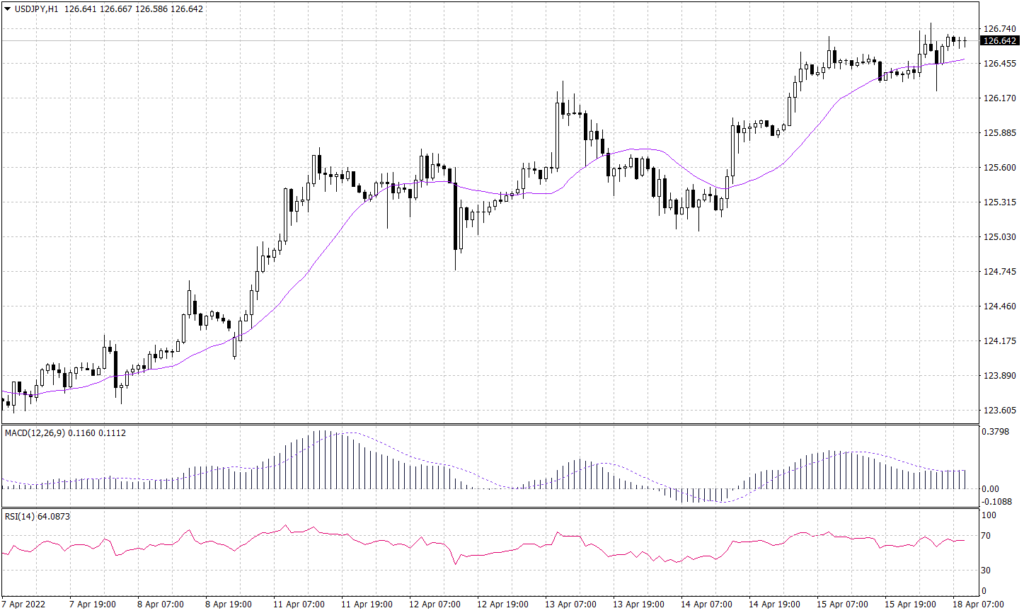
The Japanese remain above the 126.50 and show signs of further weakness. The USDJPY pair now showing signals of further advancement towards 128 as long as the pair is trading above the support of 126.50. MACD shows further advancement, likewise, the RSI shows that the pair is overbought but it signals a further increase as the signal line is flattening.
PIVOT POINT: 126.50
| S1 | S2 | S3 | |
| SUPPORT | 126.70 | 127.10 | 127.80 |
| R1 | R2 | R3 | |
| RESISTANCE | 126.00 | 125.30 | 124.35 |
Bitcoin (BTCUSD)
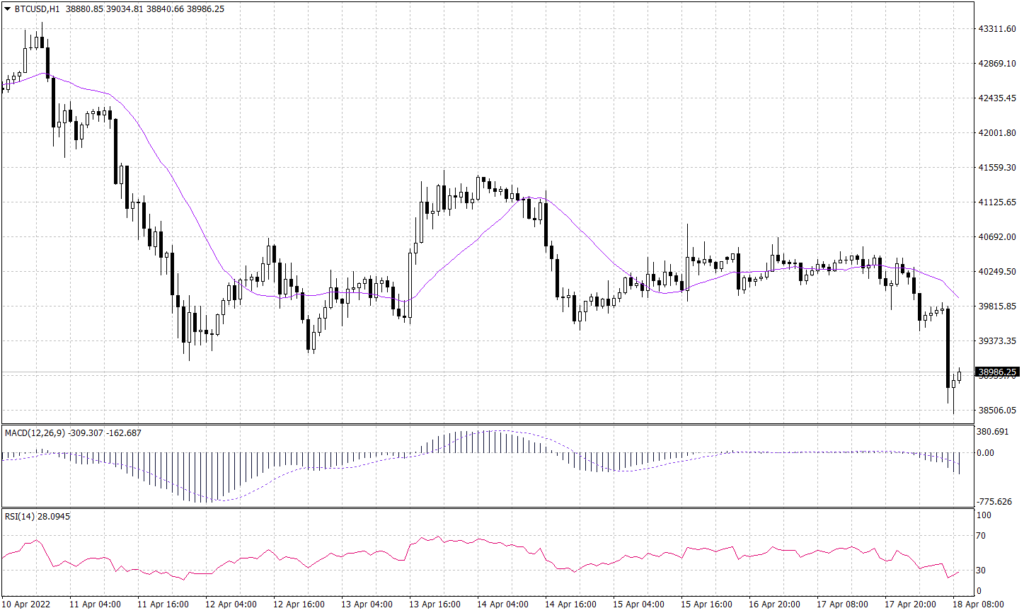
The crypto flagship broke below the horizontal channel between 39,600 and 40,200. As per the price behavior, it is most likely that Bitcoin will keep the downward trend towards 33,000. Furthermore, technical indicators do not show any signs of a rebound. MACD signals a drop below 38,500, while the RSI signals a formation of a light support level above 38,200.
PIVOT POINT: 38,890
| S1 | S2 | S3 | |
| SUPPORT | 38,500 | 38,200 | 38,000 |
| R1 | R2 | R3 | |
| RESISTANCE | 39,370 | 39,650 | 40,200 |
Spot Gold (XAUUSD)
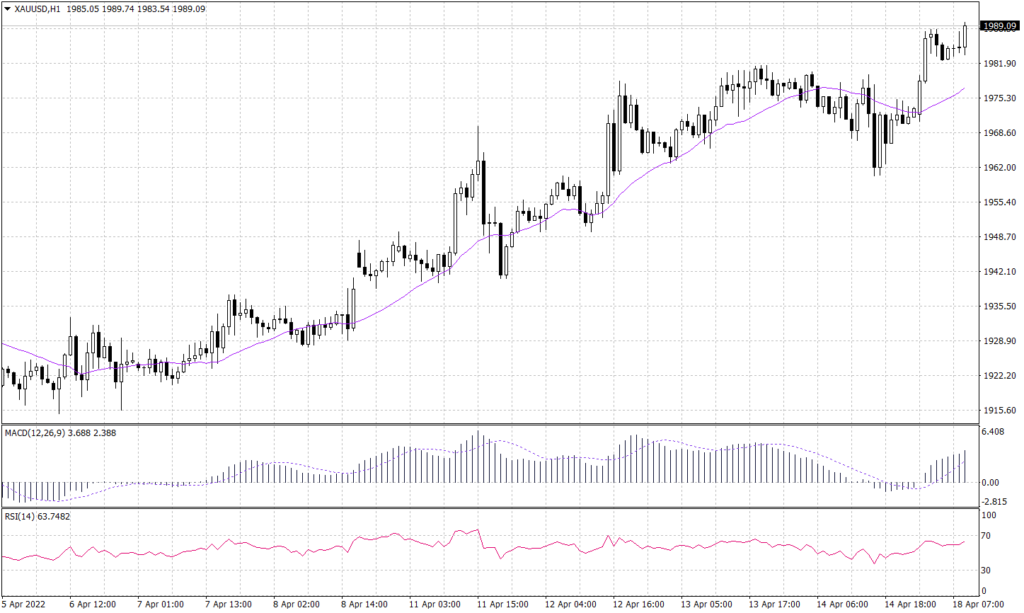
The precious metal resumes the uptrend breaking above the range between $1,970 and $1,980 per ounce. The metal is most likely to break above $2,000 targeting the resistance of $2,100. Furthermore, technical indicators support the theory of hitting a new all-time high and show signals for further advancement towards $2,100 per ounce.
PIVOT POINT: 1,990
| S1 | S2 | S3 | |
| SUPPORT | 1,980 | 1,977 | 1,960 |
| R1 | R2 | R3 | |
| RESISTANCE | 1,995 | 2,000 | 2,010 |
