

market news summary
U.S. Dollar Index (USDX)
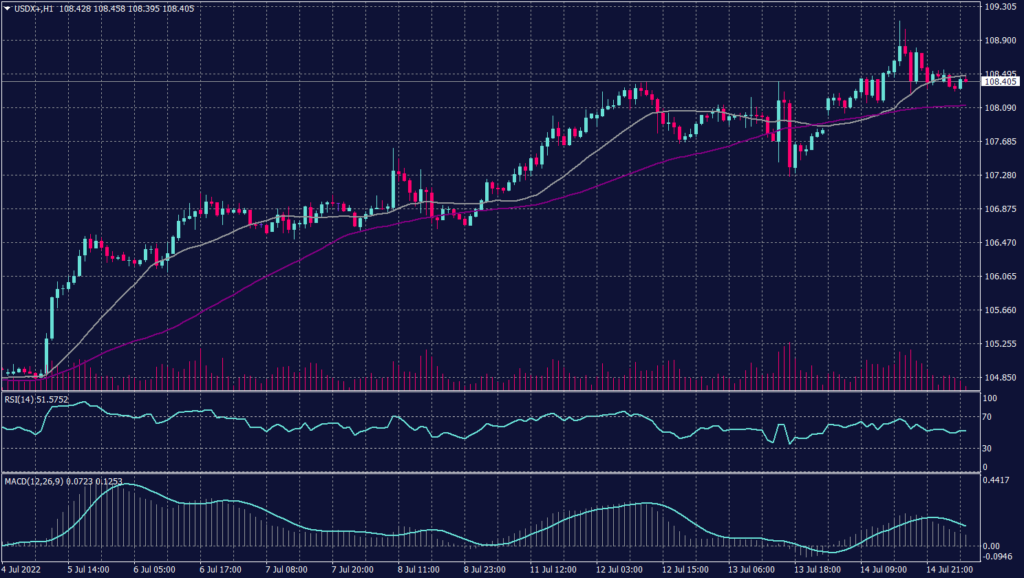
The U.S. Dollar resumed its rise this morning, pushed by expectations for faster Fed policy tightening and safe-haven flows amid growing fears of a recession. However, U.S. consumer price figures showed inflation already at four-decade highs.
Traders raised bets that the Fed could raise rates by 100 basis points when it meets on July 26-27. A hike of at least 75 basis points is seen as almost certain.
Technically:
The U.S. Dollar fell below its 20-year high, and trading is forming a horizontal pattern on the hourly chart. Additionally, the moving averages are crossed near 107.80 indicating a critical support level. However, the daily chart is not confirming the continuation as it closed a short candle on the previous day.
PIVOT POINT: 108.10
| SUPPORT | RESISTANCE |
| 107.80 | 108.60 |
| 107.40 | 108.80 |
| 106.65 | 109.20 |
Euro (EURUSD)
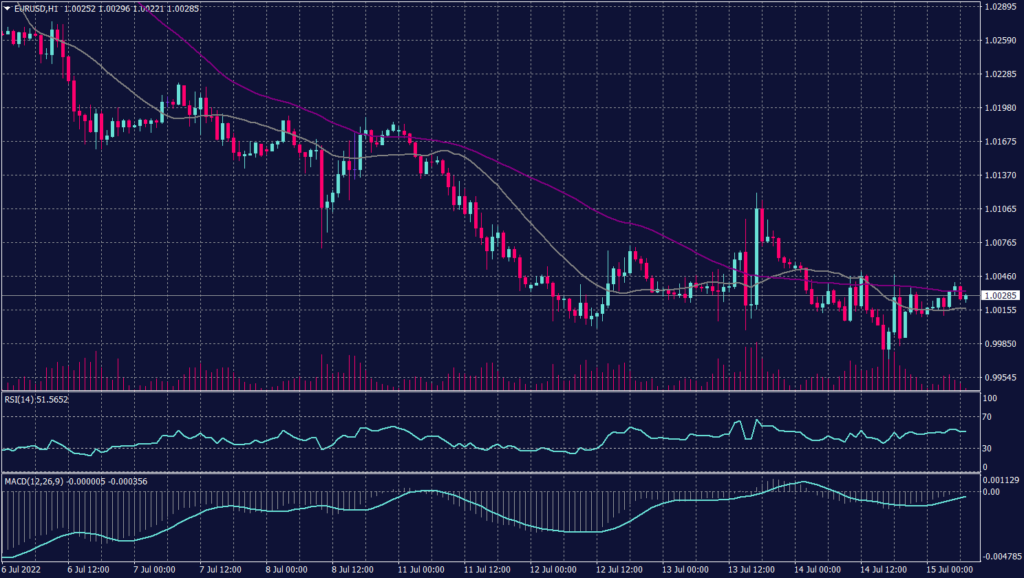
The euro’s collapse below $1 for the first time in two decades puts it on course for one of the worst years in its history. The single currency has wavered on the brink of parity versus the greenback for days, finally breaching that level during the Asian session.
Market moves put the ECB in a tight spot. However, investors expect the ECB to raise interest rates next week for the first time since 2011 to combat inflation running at a record high of 8.6%. Meanwhile, Germany has just reported its first trade deficit since 1991, and investor sentiment has dropped below levels coronavirus levels.
Technically:
The common currency remains moving lower, but the hourly chart shows slight support at the parity level. Previously, the Euro pair dropped to a new 20-year low and hindered any sign of recovery. The overall direction remains strong selling trend reaching below 0.9960
PIVOT POINT: 1.0000
| SUPPORT | RESISTANCE |
| 0.9960 | 1.0100 |
| 0.9850 | 1.0190 |
| 0.9700 | 1.0210 |
Spot Gold (XAUUSD)
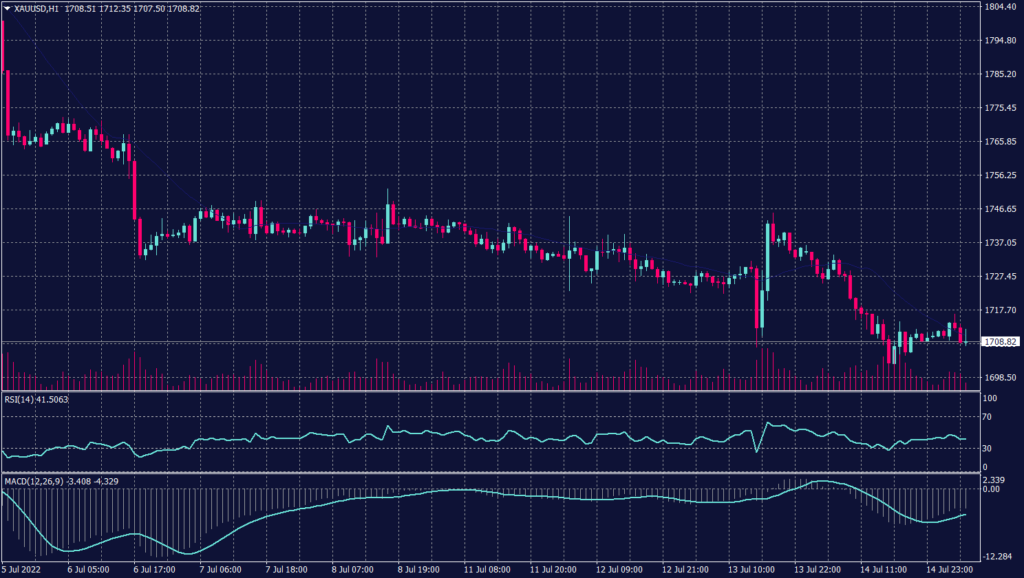
Gold fell to $1,709 on Thursday morning in Asia, with increasing anticipations that the Fed would hike interest rates more aggressively this month to fight red-hot inflation.
Meanwhile, benchmark U.S. 10-year Treasury yields rose, denting demand for zero-yield gold. Data released overnight showed the U.S. consumer prices index jumped 9.1% in June, the highest in four decades.
Gold continued the decline around the support at $1,710 per ounce this morning in Asia and shows a possibility to hit 1,700 sooner than anticipated. The daily chart, however, shows a continuation of the negative trend towards $1,680.
PIVOT POINT: 1,720
| SUPPORT | RESISTANCE |
| 1,717 | 1,740 |
| 1,710 | 1,750 |
| 1,680 | 1,770 |
West Texas Crude (USOUSD)
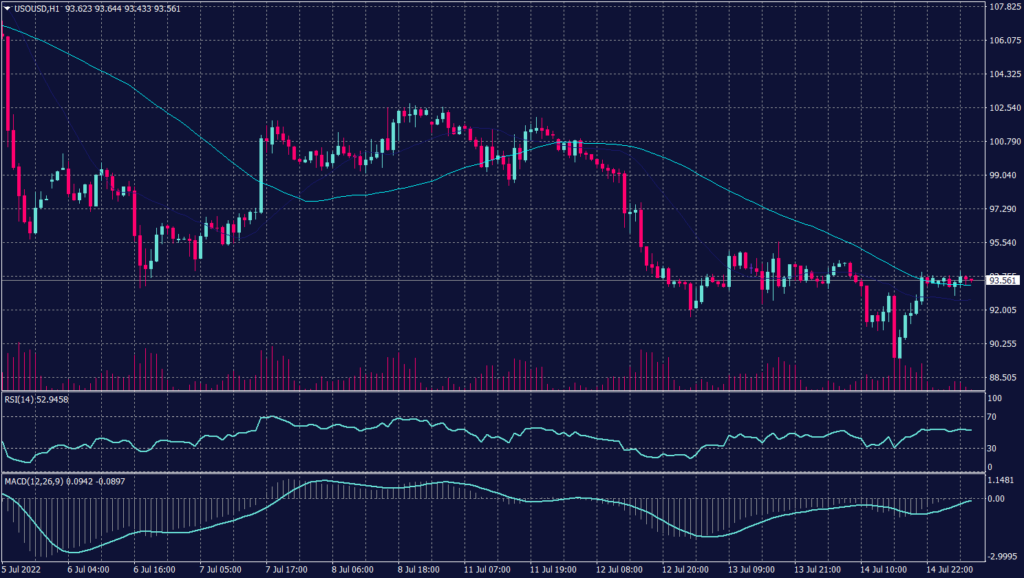
WTI Crude is settling above the support at $92.50 a barrel for the first time since April, as gains were limited by a U.S. supply report showing rising inventories and caution ahead of U.S. inflation data.
On the hourly chart, WTI prices show a decrease in volume traded due to the worries about global growth and consumption. However, the daily chart confirms the high probability of the decline and targets $90. Meanwhile, the WTI remains supported at $90.50 on the hourly chart.
PIVOT POINT: 93.40
| SUPPORT | RESISTANCE |
| 92.50 | 99.00 |
| 90.50 | 100.40 |
| 87.00 | 102.00 |
