

MARKET NEWS SUMMARY
U.S. dollar index (USDX)

The U.S. dollar index traded up yesterday amid positive sales data. However, the index gained nearly 1% touching the resistance of 100.4. Technical indicators show a slight retreat in the value towards the level of 100 but retain the strong uptrend later.
PIVOT POINT: 100.40
| S1 | S2 | S3 | |
| SUPPORT | 100.25 | 100.10 | 99.70 |
| R1 | R2 | R3 | |
| RESISTANCE | 100.60 | 100.75 | 101.10 |
Euro (EURUSD)
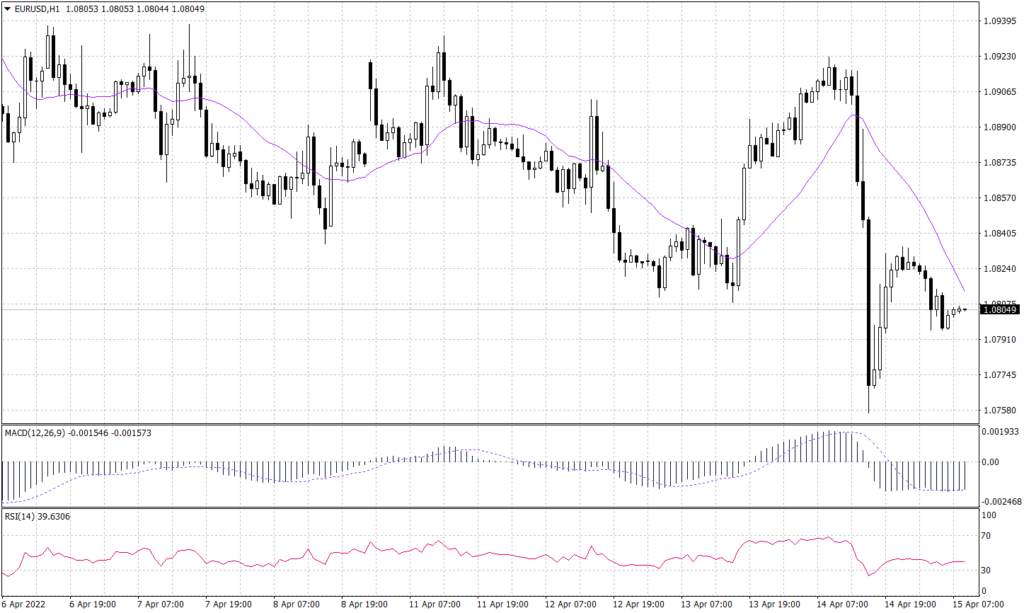
The Euro traded lower yesterday as the U.S. dollar rose. The common currency shed around 1%, reaching its lowest in two years at 1.0757. Technically, the EURUSD pair remains inside the downward channel started in January 2021, and it is not showing any signs of breaking out anytime soon. Technical indicators are moving flat on the daily chart while signaling a further drop in the daily time frame.
PIVOT POINT: 1.0815
| S1 | S2 | S3 | |
| SUPPORT | 1.0775 | 1.0750 | 1.0600 |
| R1 | R2 | R3 | |
| RESISTANCE | 1.0830 | 1.0855 | 1.1080 |
Japanese Yen (USDJPY)
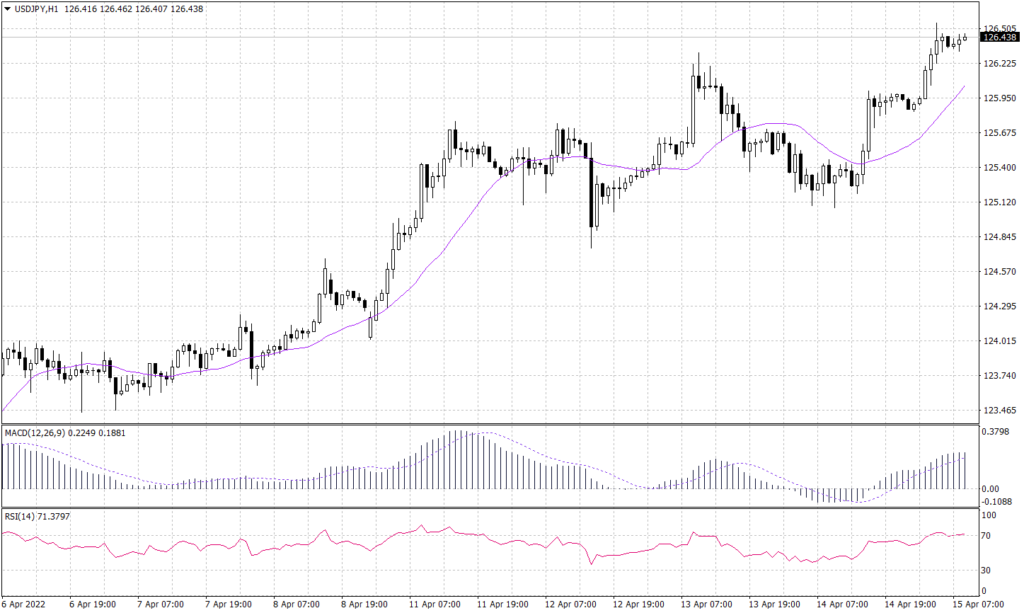
The Japanese currency fell 0.5% to 126.56 per dollar to extend a 20-year low as the yield gap is widening. The USDJPY pair is not finding strong resistance after breaking the level of 125. MACD shows further advancement, likewise, the RSI shows that the pair is overbought but it signals a further increase as the signal line is flattening.
PIVOT POINT: 126.50
| S1 | S2 | S3 | |
| SUPPORT | 126.70 | 127.10 | 127.80 |
| R1 | R2 | R3 | |
| RESISTANCE | 126.00 | 125.30 | 124.35 |
Bitcoin (BTCUSD)
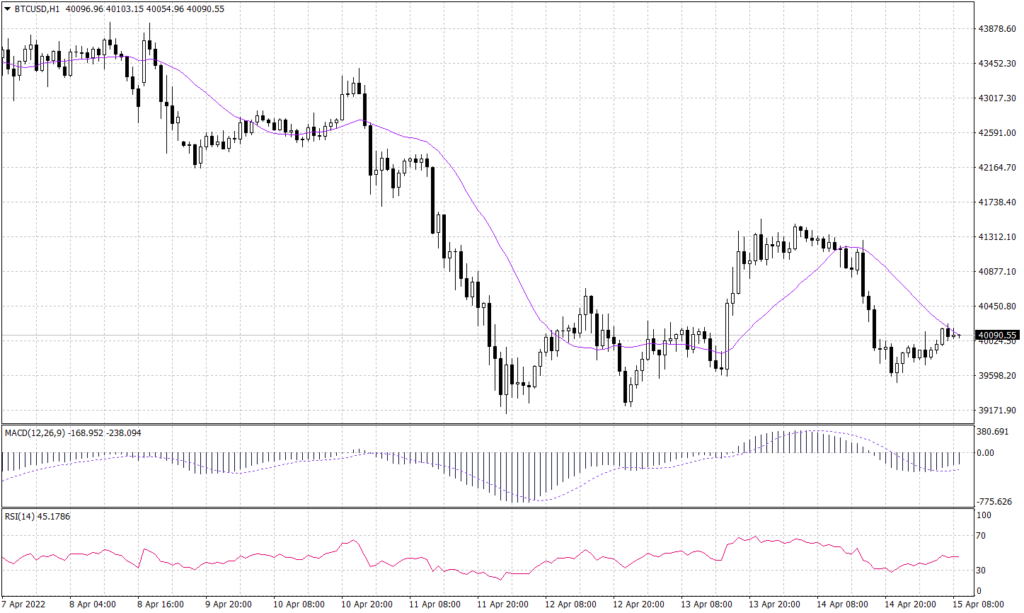
Crypto leading coin is moving horizontally between 39,600 and 40,200. Although these levels are light support and resistance, it is not likely that Bitcoin will break out of this channel during today’s trades. However, technical indicators are indifferent.
PIVOT POINT: 40,100
| S1 | S2 | S3 | |
| SUPPORT | 39,600 | 39,300 | 39,170 |
| R1 | R2 | R3 | |
| RESISTANCE | 40,200 | 40,450 | 40,870 |
