

market news summary
USDX moving flat;
USD peers continue to fall;
Gold towards $1,825.
U.S. Dollar Index (USDX)
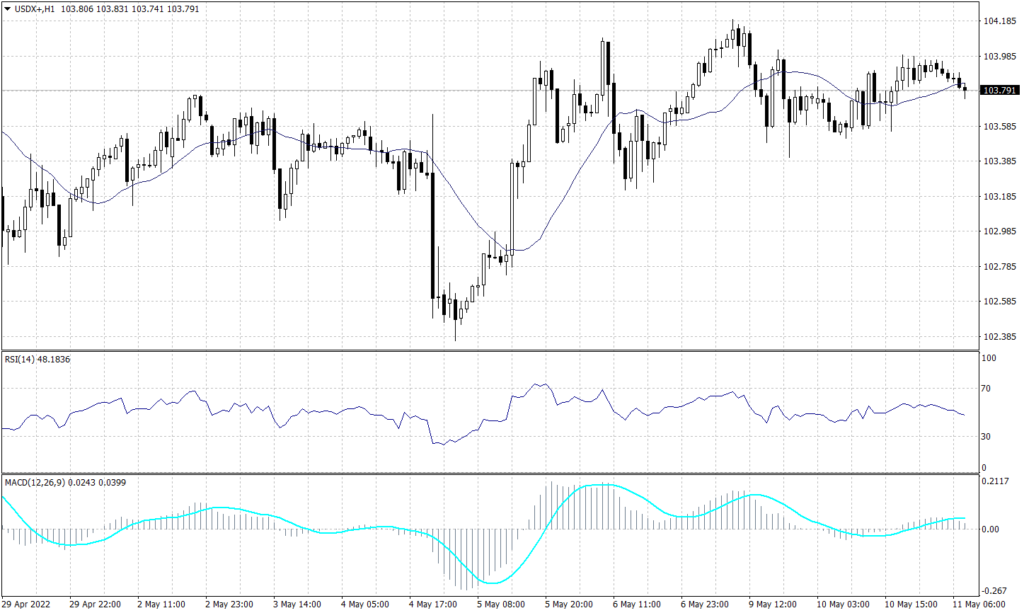
The dollar was down on Wednesday morning in Asia, but remained near a two-decade high, ahead of U.S. inflation that could indicate how aggressively the Federal Reserve will tighten monetary policy.
Technically, the index established strong support at 103.60 on the daily chart but price action kept the possibility of a decline towards 102.70. However, on the hourly chart, technical indicators and trend lines expect the index to trade lower towards 103.20 during the day.
PIVOT POINT: 103.80
| R1 | R2 | R3 | |
| RESISTANCE | 104.10 | 104.30 | 104.60 |
| S1 | S2 | S3 | |
| SUPPORT | 103.60 | 103.20 | 102.70 |
Euro (EURUSD)
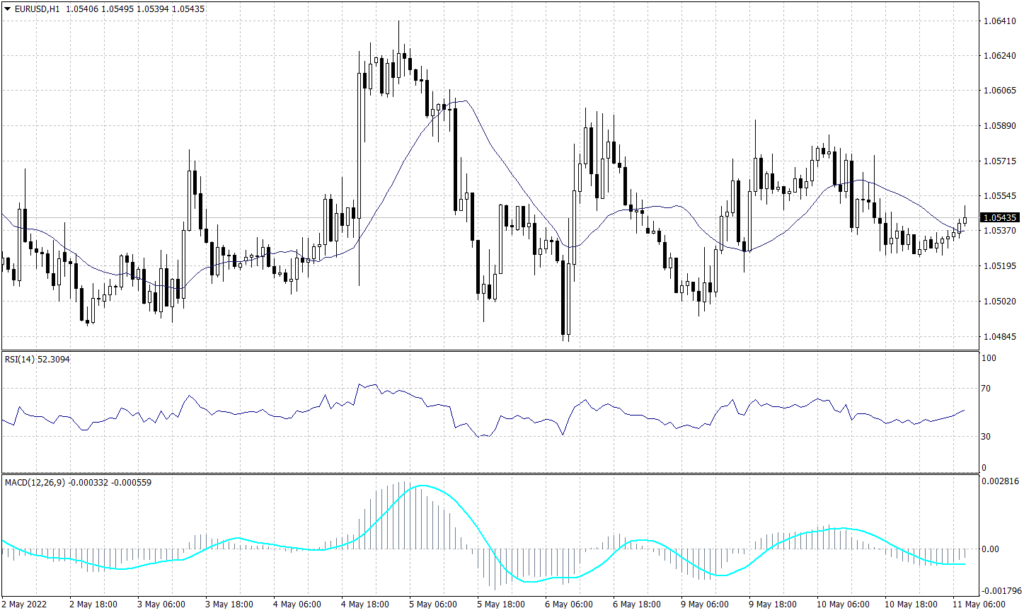
The common currency remains on the primary downtrend, on the hourly chart, the chart shows a high tendency of a decline by the evening time. The pair is unlikely to break above the resistance of 1.0570 and it is set to continue falling during the day.
Technical indicators signal a continuation towards 1.04925. Meanwhile, in the longer term, the pair is set to continue its primary downtrend.
PIVOT POINT: 1.0570
| R1 | R2 | R3 | |
| RESISTANCE | 1.0650 | 1.0675 | 1.0730 |
| S1 | S2 | S3 | |
| SUPPORT | 1.0490 | 1.0410 | 1.0350 |
Sterling Pounds (GBPUSD)
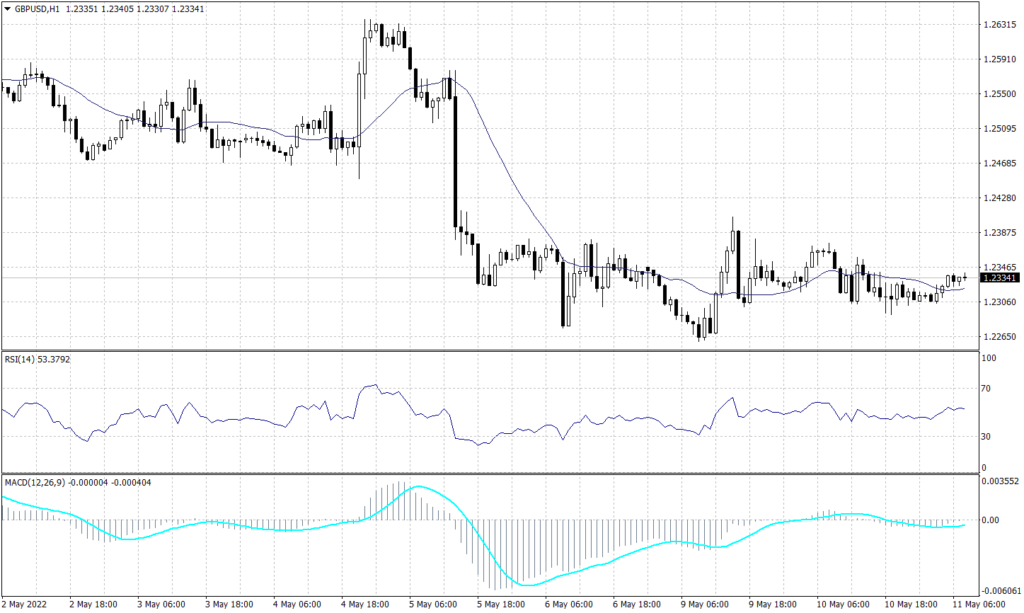
The sterling pound traded flat against the greenback during the early trades. On the daily chart, the Cable is set to continue the primary decline to touch its lowest rate since May 2020 below 1.2100.
On the daily chart, the pair is expected to fall to 1.2070, while the hourly chart shows a likelihood to trade around 1.2000 during the day. The RSI and MACD are showing signals for a further decline in a slow fashion, while price action retains the reading of 1.2100 during the day.
PIVOT POINT: 1.2300
| R1 | R2 | R3 | |
| RESISTANCE | 1.2400 | 1.2565 | 1.2690 |
| S1 | S2 | S3 | |
| SUPPORT | 1.2070 | 1.1980 | 1.1900 |
Japanese Yen (USDJPY)
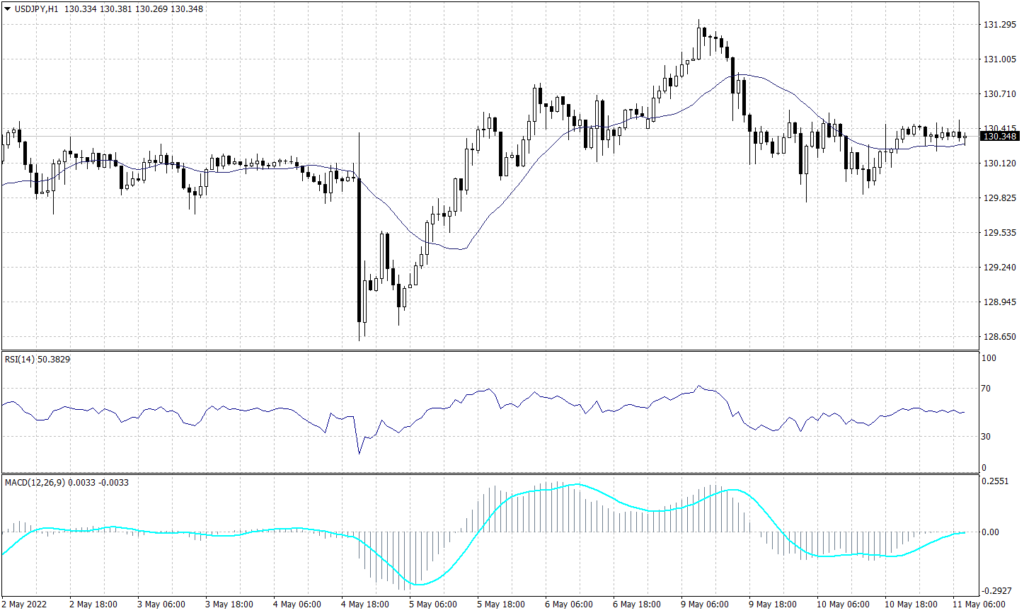
The USDJPY pair remains around the resistance of 130.30 and trades horizontally with indecisive readings. While the moving average reading indicates that the current level is critical resistance, MACD and RSI readings are neutral.
PIVOT POINT: 130.30
| R1 | R2 | R3 | |
| RESISTANCE | 130.60 | 131.30 | 132.00 |
| S1 | S2 | S3 | |
| SUPPORT | 128.70 | 128.35 | 128.00 |
Spot Gold (XAUUSD)
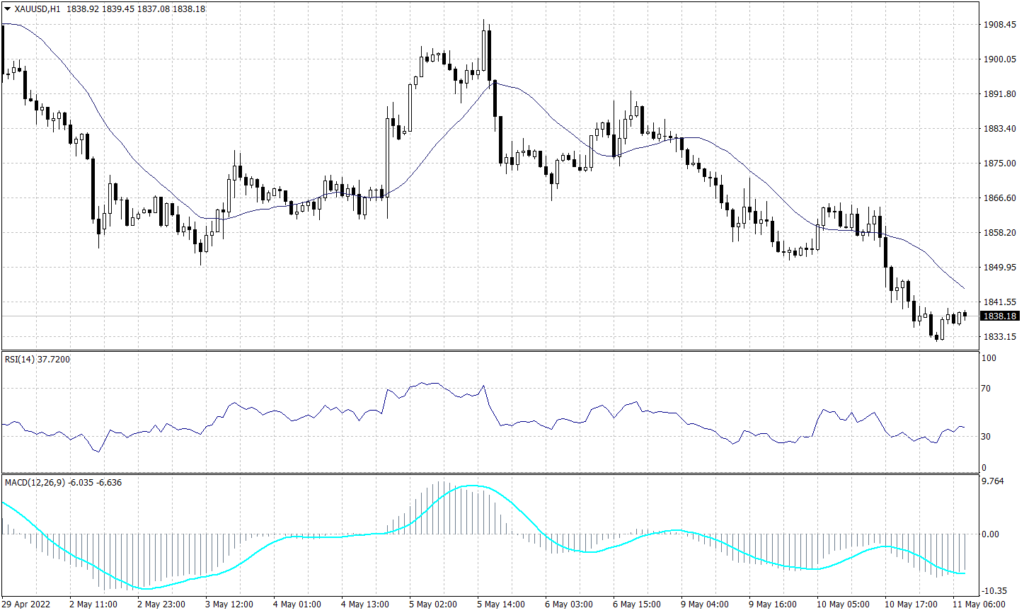
The precious metal traded at a low of 1,831.95 during the early trades before the U.S. CPI data. Gold prices retain their negative trend on the daily chart, and it is likely to continue the downward trend targeting 1,826 later during the day.
The daily chart shows a continuation of the bearish trend line targeting the range between 1,825 to 1,800. Meanwhile, the hourly chart shows gold in a light volume area, which indicates to touch 1,826. Furthermore, both the RSI and the MACD imply that the bearish trend will continue.
PIVOT POINT: 1,840
| R1 | R2 | R3 | |
| RESISTANCE | 1,890 | 1,895 | 1,905 |
| S1 | S2 | S3 | |
| SUPPORT | 1,825 | 1,800 | 1,792 |
WTI (USOUSD)
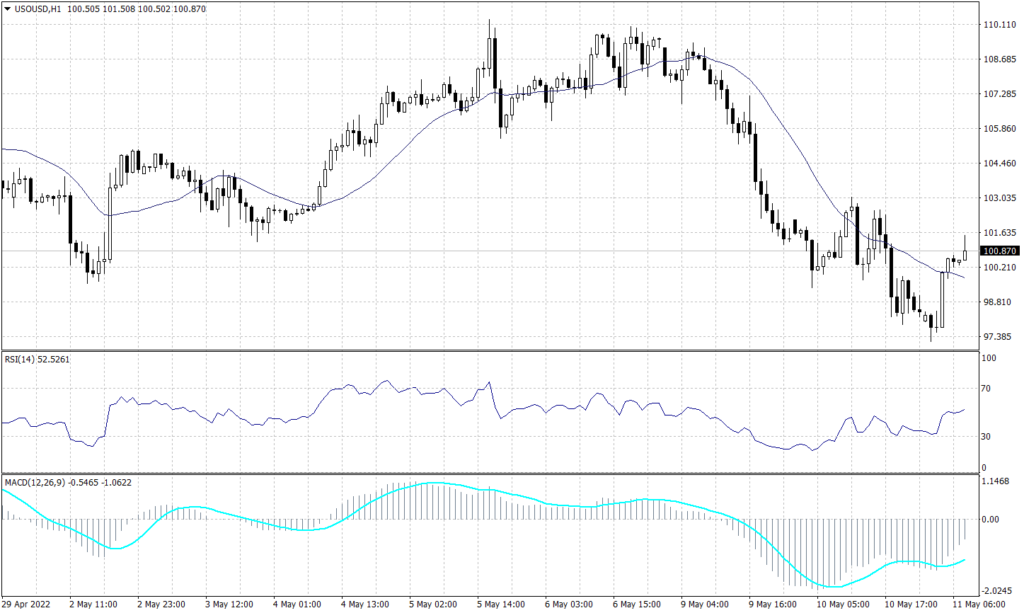
West Texas Intermediate touched its lowest price since late April before bouncing back above $100 a barrel. Moving average and MACD indicate a possible rebound towards $105. Meanwhile, the RSI and price action signal a further decline
PIVOT POINT: 100.50
| R1 | R2 | R3 | |
| RESISTANCE | 103.40 | 105.10 | 108.40 |
| S1 | S2 | S3 | |
| SUPPORT | 97.25 | 95.20 | 90.00 |
