

market news summary
U.S. Dollar is losing the momentum;
Currencies tend to further decline;
Bitcoin is targeting 26,500;
Gold towards $1,825;
Geopolitics affect crude prices.
U.S. Dollar Index (USDX)
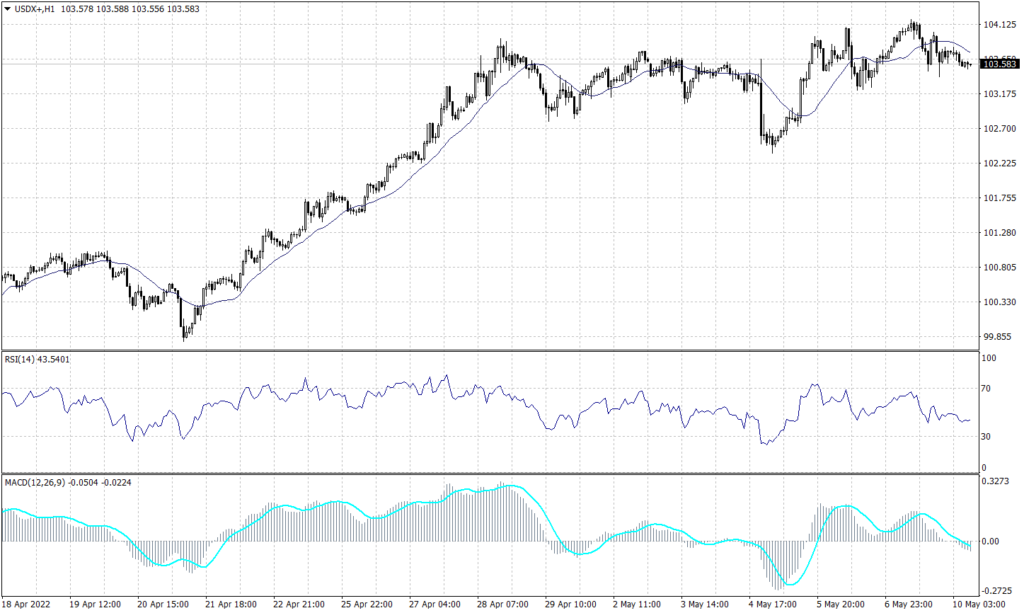
The dollar hit a two-decade high on Monday and retreated during the day to the support level of 103.60. Today, the index hovered horizontally with a possibility of retreating towards 103.20.
Technically, the index established strong support at 103.60 on the daily chart but price action kept the possibility of a decline towards 102.70. However, on the hourly chart, technical indicators and trend lines expect the index to trade lower towards 103.20 during the day.
PIVOT POINT: 103.00
| R1 | R2 | R3 | |
| RESISTANCE | 104.10 | 104.30 | 104.60 |
| S1 | S2 | S3 | |
| SUPPORT | 103.60 | 103.20 | 102.70 |
Euro (EURUSD)
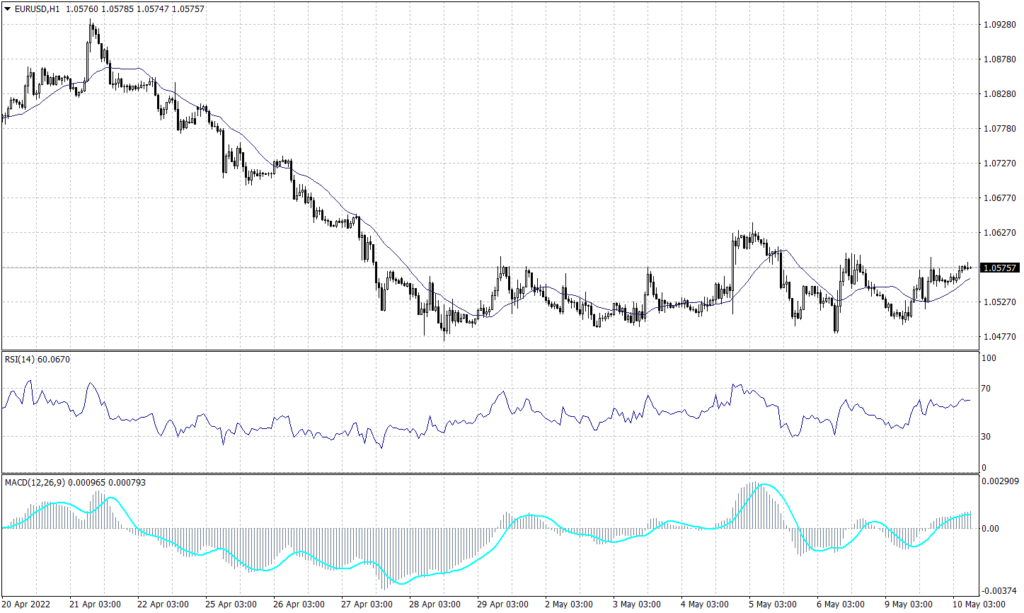
The common currency remains on the primary downtrend, but on the hourly chart, it shows a rebound to the resistance of 1.0570. The pair is unlikely to change direction based on the current price action and it might continue falling during the day.
Technical indicators signal a continuation towards 1.04925. Meanwhile, in the longer term, the pair is set to continue its primary downtrend.
PIVOT POINT: 1.0570
| R1 | R2 | R3 | |
| RESISTANCE | 1.0650 | 1.0675 | 1.0730 |
| S1 | S2 | S3 | |
| SUPPORT | 1.0490 | 1.0410 | 1.0350 |
Sterling Pounds (GBPUSD)
The sterling pound traded flat against the greenback during the early trades. On the daily chart, the Cable is set to continue the primary decline to touch its lowest rate since May 2020 below 1.2100.
On the daily chart, the pair is expected to fall to 1.2070, while the hourly chart shows a likelihood to trade around 1.2000 during the day. The RSI and MACD are showing signals for a further decline in a slow fashion, while price action retains the reading of 1.2100 during the day.
PIVOT POINT: 1.2300
| R1 | R2 | R3 | |
| RESISTANCE | 1.2400 | 1.2565 | 1.2690 |
| S1 | S2 | S3 | |
| SUPPORT | 1.2070 | 1.1980 | 1.1900 |
Japanese Yen (USDJPY)
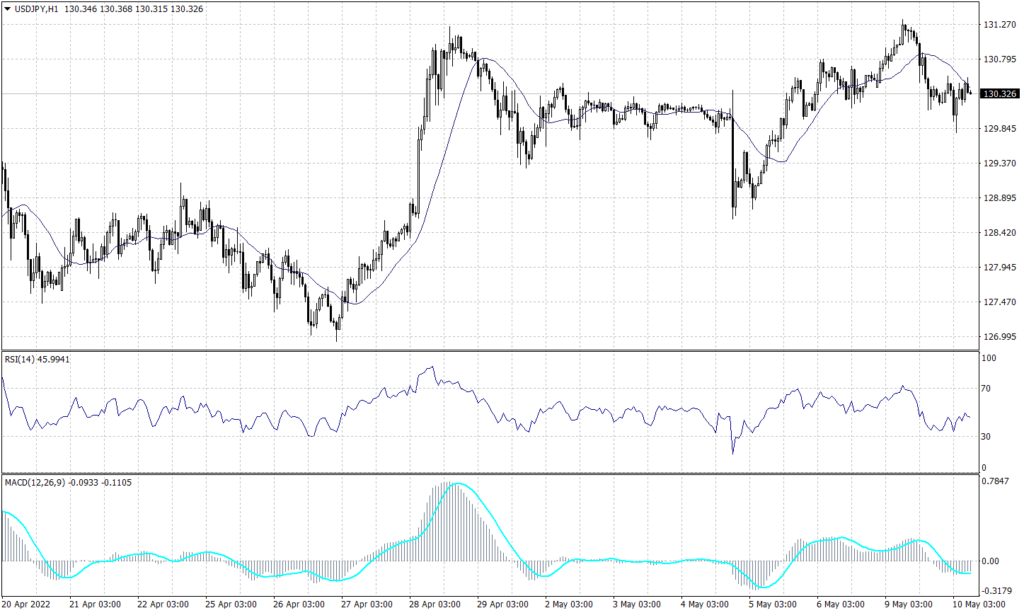
The USDJPY pair closed above the resistance of 130 on Friday and traded higher after the opening of the Asian session.
The primary trend remains upwards targeting 132. The pair retains the bullish trend on the hourly chart despite yesterday’s fall and is supported above the broken resistance of 130. Technical indicators imply that prices are likely to hover between 130.60 and 131.50.
PIVOT POINT: 130.60
| R1 | R2 | R3 | |
| RESISTANCE | 131.30 | 132.00 | 132.40 |
| S1 | S2 | S3 | |
| SUPPORT | 128.70 | 128.35 | 128.00 |
Spot Gold (XAUUSD)
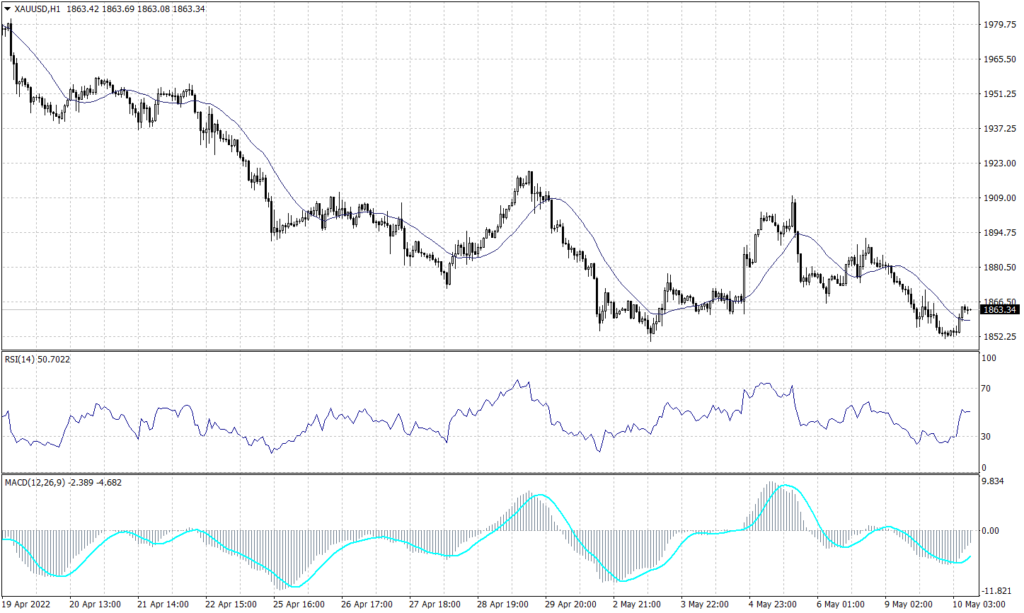
The precious metal traded at 1,863 during the early trades benefiting from the slight decrease in market sentiment. Gold prices retain their negative trend on the daily chart, but it is likely to continue the long-term downward trend.
The daily chart shows a continuation of the bearish trend line targeting the range between 1,825 to 1,800. Meanwhile, the hourly chart shows gold in a light volume area, which indicates to touch 1,855. Furthermore, both the RSI and the MACD imply that the bearish trend will continue.
PIVOT POINT: 1,865
| R1 | R2 | R3 | |
| RESISTANCE | 1,890 | 1,895 | 1,905 |
| S1 | S2 | S3 | |
| SUPPORT | 1,855 | 1,825 | 1,800 |
WTI (USOUSD)
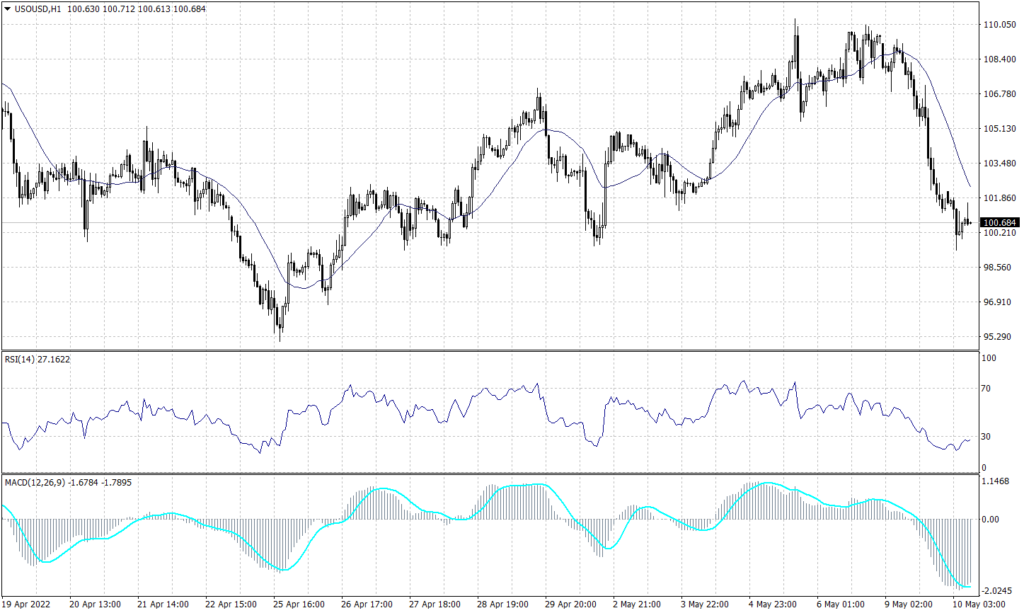
West Texas Intermediate crude lost $8 yesterday reaching near $100 a barrel, the lowest in a week. Technical indicators are mixed today, MACD and RSI show a possibility to rebound to $105, while the moving average shows a signal of further decline.
PIVOT POINT: 100.50
| R1 | R2 | R3 | |
| RESISTANCE | 103.40 | 105.10 | 108.40 |
| S1 | S2 | S3 | |
| SUPPORT | 99.50 | 98.60 | 95.20 |
Bitcoin (BTCUSD)
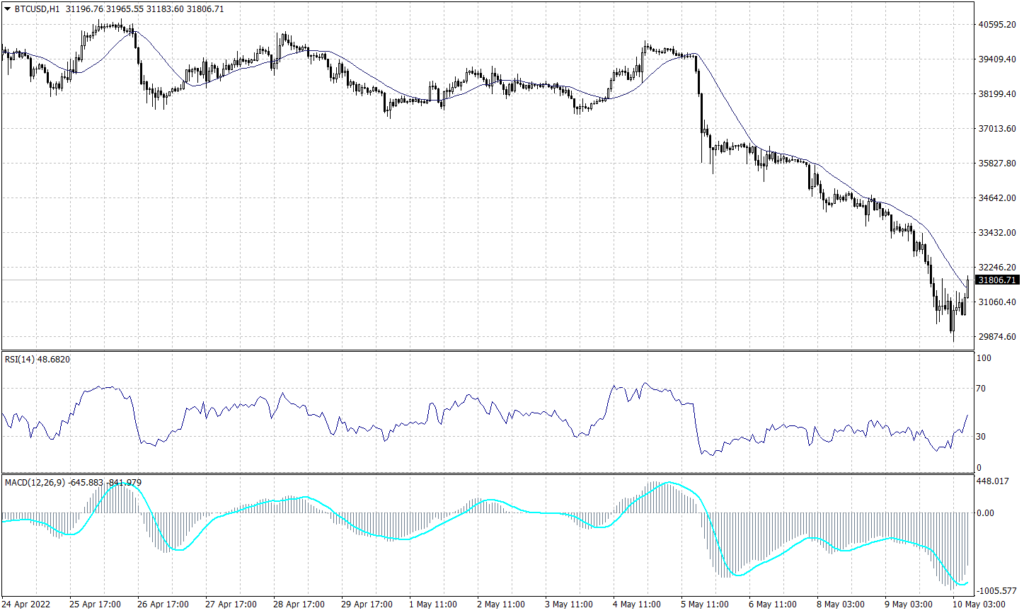
On Monday, Bitcoin fell to its lowest level since July 2021 to as low as $29,692, before rebounding to $31,800. The Crypto flagship is showing a continuation of the current decline towards $26,500 on the daily chart. Meanwhile, the hourly chart shows a further decline under the condition of breaking below 31,060.
Technically, MACD and RSI are showing a slowdown in the trend but the moving average signals more decline.
PIVOT POINT: 31,800
| R1 | R2 | R3 | |
| RESISTANCE | 32,250 | 34,080 | 34,800 |
| S1 | S2 | S3 | |
| SUPPORT | 31,060 | 29,875 | 28,500 |
