

market news summary
U.S. Dollar Index (USDX)
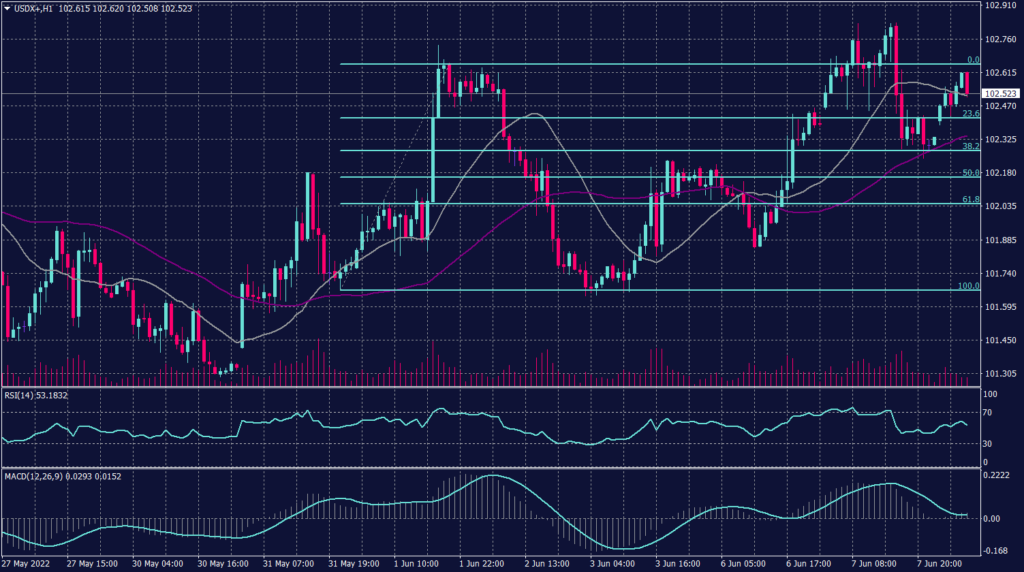
The U.S. dollar index reverted from earlier highs and fell on Tuesday as Wall Street stocks erased initial declines amid growing hopes that inflation may have peaked.
Longer-dated U.S. Treasury yields hit over three weeks’ high overnight on concerns the Federal Reserve will continue its aggressive policy. Additionally, while the Fed seeks to control inflation, it also eased tapering as inflation could slow the central bank’s hiking plans.
Technically:
The U.S. Dollar index formed a declining pattern as bears formed resistance at 102.60, but the USDX remains trading above 102.30 for the time being. Meanwhile, on the daily chart, the USDX is trying to break away from the declining trendline, but it remains bearish for the longer term.
On the hourly chart, 20 SMA and 55 SMA are moving below the current price levels pointing support formation.
PIVOT POINT: 102.40
| SUPPORT | RESISTANCE |
| 102.30 | 102.60 |
| 102.00 | 102.80 |
| 101.90 | 103.00 |
Euro (EURUSD)
The ECB meets on Thursday and markets are expecting it to at least lay the groundwork for rapid rate rises. Additionally, Economic data released on Wednesday showed that German industrial production rose 0.7% in April, recording an improvement from the drop of 3.7% in the previous month.
French trade data and Italian retail sales for April are due later in the day, ahead of first-quarter Eurozone employment and GDP numbers.
Technically:
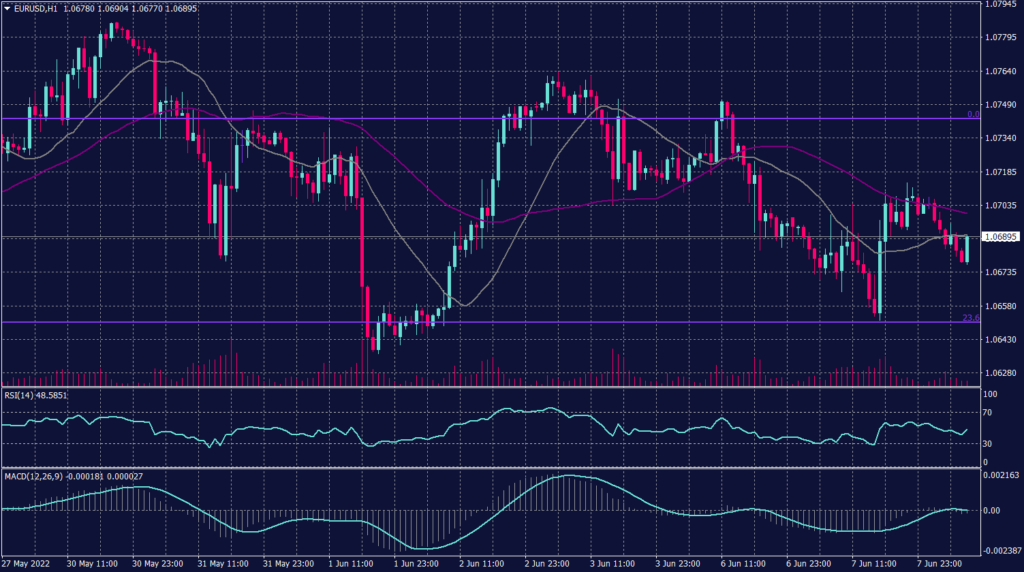
Bears remain in control over the overall trend of the currency while heading towards 1.0650.
Fibonacci retracement shows resistance1.0750 and fairly strong support at 1.0650, on the other hand, technical indicators show a possibility of a decline. Though, moving averages show a horizontal movement and set resistance at 1.0700.
PIVOT POINT: 1.0680
| SUPPORT | RESISTANCE |
| 1.0650 | 1.0720 |
| 1.0610 | 1.0780 |
| 1.0550 | 1.0840 |
Japanese Yen (USDJPY)
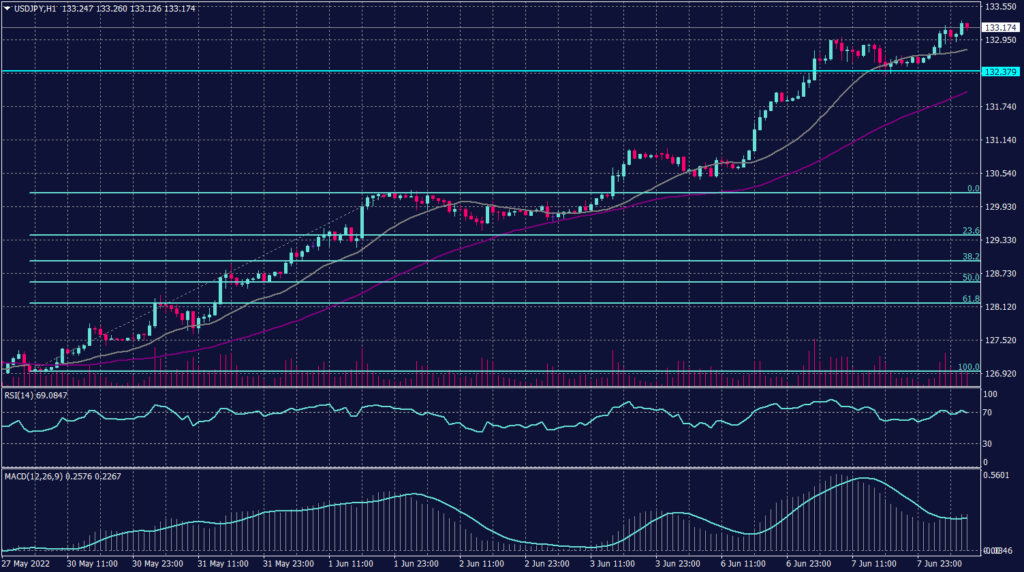
The yen hit a fresh 20-year low versus the dollar losing more than 4.5% from 127.09 per dollar to touching 133.22 in eight sessions.
Japan’s first-quarter economy beat expectations with the country’s gross domestic product (GDP) shrinking 0.5% in January-March year-on-year, smaller than the preliminary reading of the 1.0% drop released last month.
Technically:
On the daily chart, the USDJPY is a continuation of the current uptrend, while daily chart technical indicators show a slowdown. Though, Technical indicators on both the hourly and the daily charts are easing and signalling a change in the trend. that the pair is slowing the rise.
PIVOT POINT: 133.00
| SUPPORT | RESISTANCE |
| 132.00 | 133.50 |
| 130.00 | 134.20 |
| 127.00 | 134.50 |
Spot Gold (XAUUSD)
Gold traded 0.05% lower at 1,851.05 this morning during the Asian sessions as market participants await the U.S. consumer price index (CPI) for more clues on the interest rate hikes.
U.S. Treasury Secretary Janet Yellen said on Tuesday that inflation might remain high, and the Biden administration is likely to increase the 4.7% inflation forecast for this year in its budget proposal.
Technically:
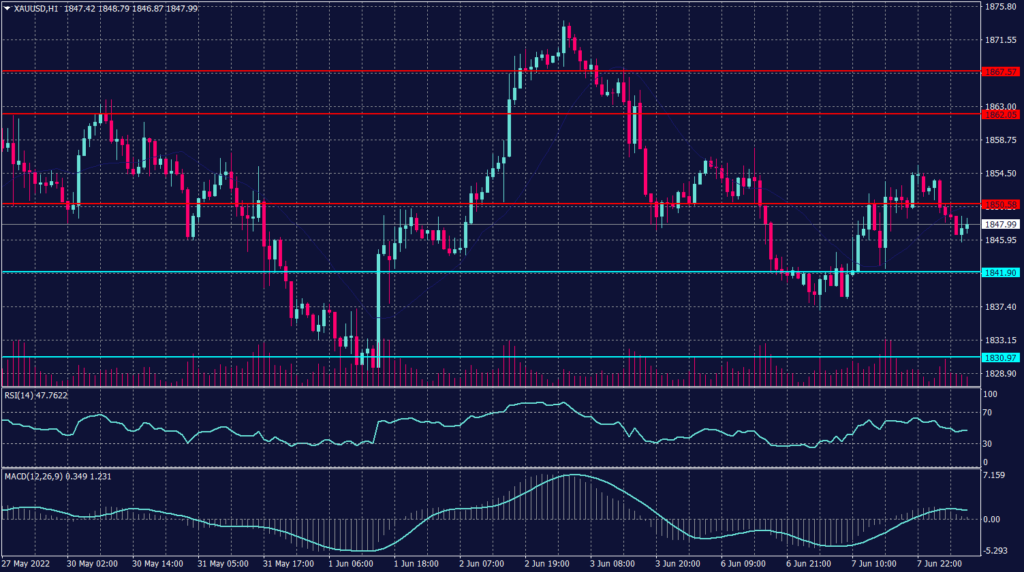
The yellow metal traded lower and formed a bearish pattern below 1,854 and showed a tendency to form a resistance below the previous support of 1,852. Gold prices are set for a decline towards 1,810 on the daily chart. Meanwhile, in the hourly chart, spot gold penetrated out of the regression channel, but it remains set to decline.
On the daily chart, the precious metal returns to its primary decline trend targeting the resistance at 1,810 and 1,790. However, spot gold shows a change in direction and signals further decline below the support at 1,842 during the day.
PIVOT POINT: 1,852
| SUPPORT | RESISTANCE |
| 1,842 | 1,866 |
| 1,837 | 1,872 |
| 1,830 | 1,875 |
West Texas Crude (USOUSD)
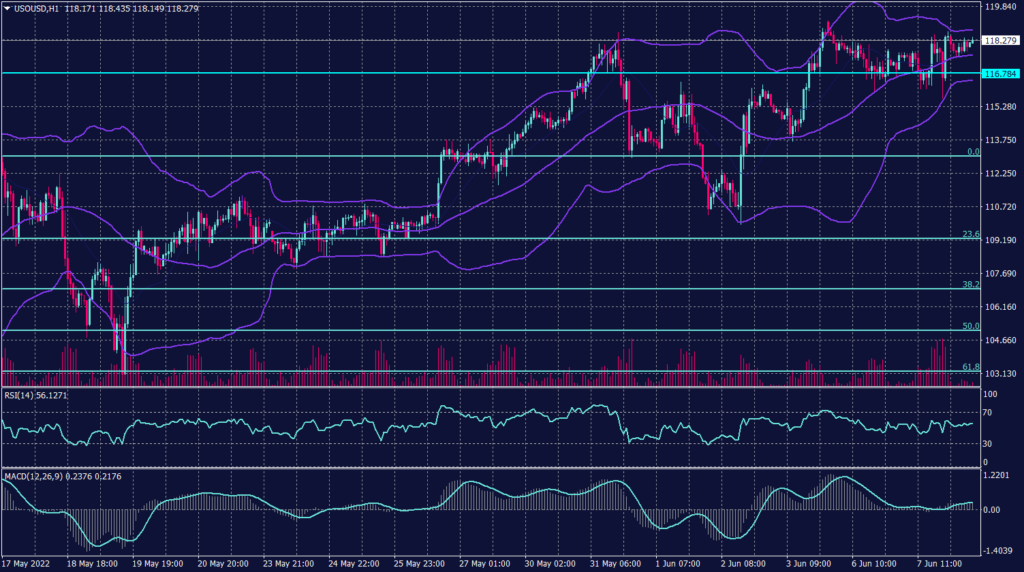
Crude oil headed up this morning and it found a shelter in the tight supplies and recovering fuel demand as China continued easing COVID-19 restrictions. Brent oil futures hit $120.73 while WTI futures rose to $119.70. Tuesday’s U.S. crude supply data from the American Petroleum Institute showed a build of 1.845 million barrels.
Technically:
WTI found resistance at $118 a barrel amid heavy selling activities and profit collection. WTI remains in the uptrend on the daily chart targeting $122 a barrel while forming support above $115 as per the 55 SMA readings.
However, today WTI is likely to swing to the same level as the 55 SMA at $117.50. Fibonacci retracement shows firm support at 115 and is stronger if held above 113.40. RSI is showing WTI is oversold, while MACD shows a continuation of the decline.
PIVOT POINT: 117.50
| SUPPORT | RESISTANCE |
| 115.00 | 119.00 |
| 109.50 | 120.00 |
| 108.30 | 123.00 |
