

Market news summary
Technical trends remain the same;
The most anticipated day of the week;
Extra caution is recommended;
USDX is at strong resistance.
U.S. Dollar Index (USDX)
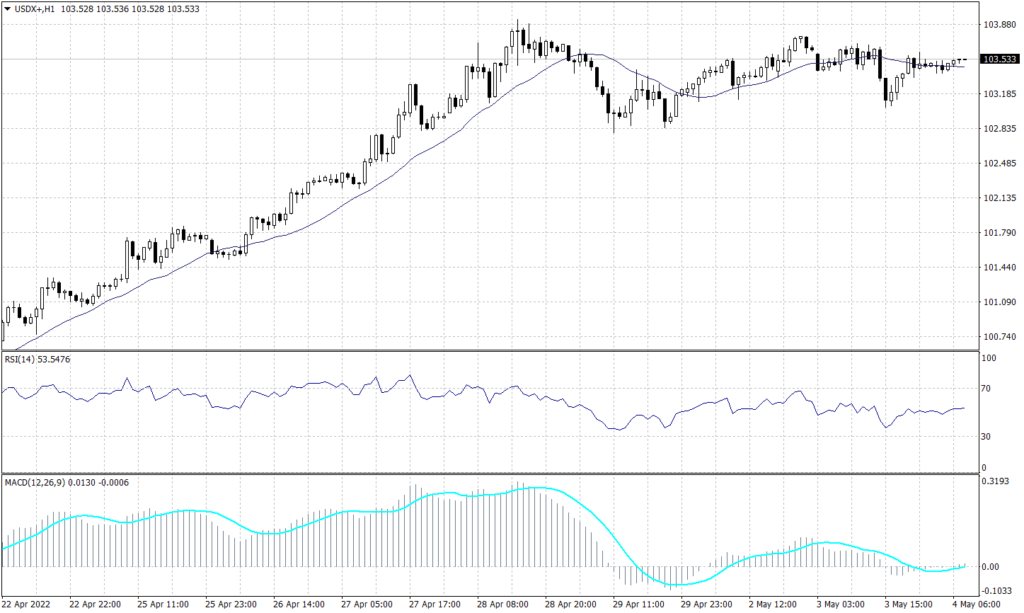
The U.S. Dollar traded around 103.50 slightly below its all-time high of 103.90. The current level seems to be massive resistance as traders are waiting for the FOMC meeting. After the interest rate hike announcement, the U.S. Dollar might show impulsive movements that will determine the trend.
Technically, the index will keep trading in a slow pattern until it breaks above 104 for a new high or below 103 for a reversal trend towards 101.10. Technical indicators like the RSI and MACD, on the other hand, continue to show prices moving upward.
PIVOT POINT: 103.50
| R1 | R2 | R3 | |
| RESISTANCE | 103.80 | 104.00 | |
| S1 | S2 | S3 | |
| SUPPORT | 103.10 | 102.80 |
Euro (EURUSD)
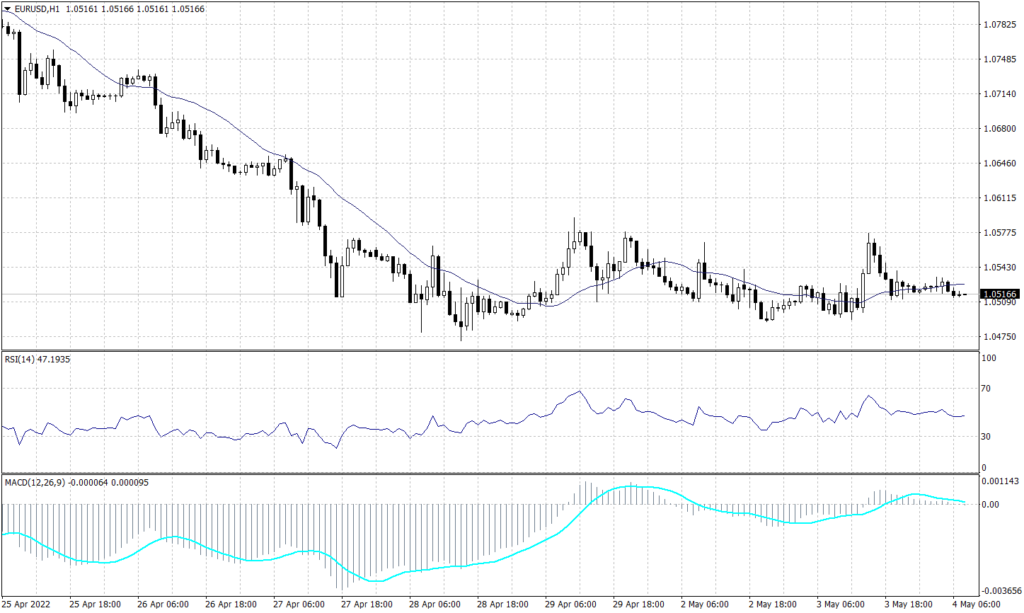
The Euro remains near its five years low despite the short swings to 1.0577 and it keeps the downtrend on the daily chart as well as the hourly chart. In the short term, for the EURUSD to bounce up the prices should break above 1.0580, while in the long term it might show a slight sign of recovery if it broke above the resistance range between 1.0800 and 1.0940. As the technical indicators show stability around the current levels, while price action indicates a probability to drop further.
PIVOT POINT: 1.0520
| R1 | R2 | R3 | |
| RESISTANCE | 1.0575 | 1.0610 | 1.0650 |
| S1 | S2 | S3 | |
| SUPPORT | 1.0490 | 1.0455 | 1.0410 |
Sterling Pounds (GBPUSD)
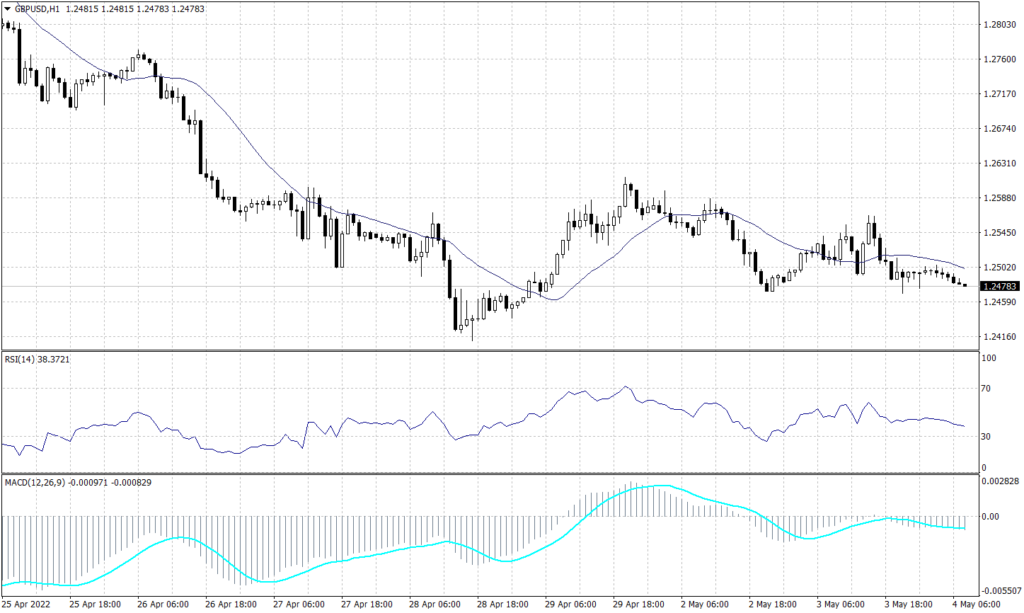
The Cable retains its downtrend under the pressure from the U.S. Dollar, the sterling pound will be under heavier pressure later this week as traders wait for the BoE statement. However, it is expected for the sterling pound to reach the low of 1.2300 before bulls reclaim the lead or slow down the fall.
The RSI and MACD are showing signals for a further decline in a slow fashion, while price action retains the reading of a low of 1.2300.
PIVOT POINT: 1.2500
| R1 | R2 | R3 | |
| RESISTANCE | 1.2565 | 1.2635 | 1.2690 |
| S1 | S2 | S3 | |
| SUPPORT | 1.2440 | 1.2360 | 1.2300 |
Japanese Yen (USDJPY)
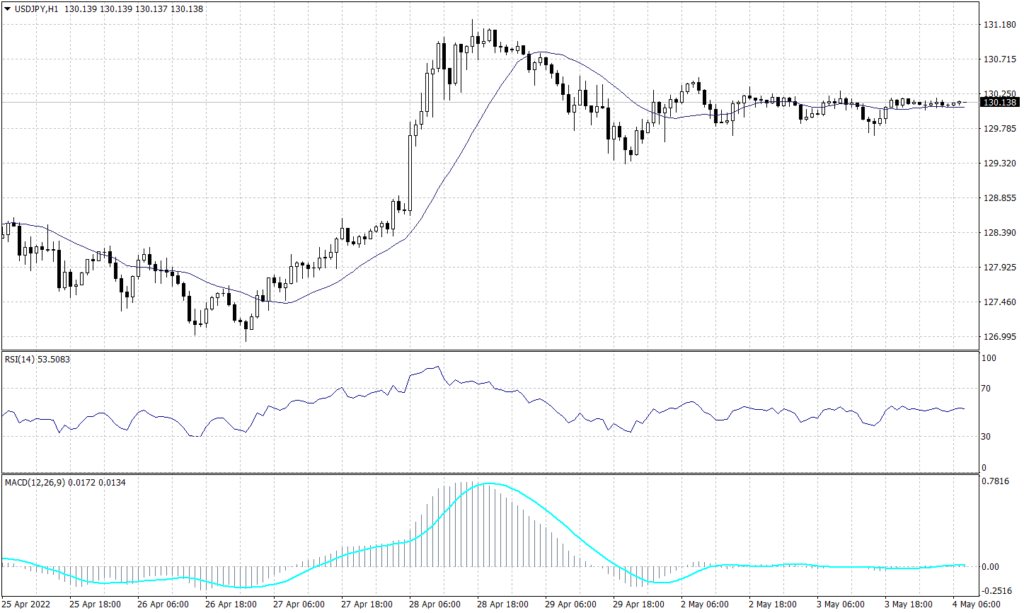
The USDJPY remains on an uptrend on the daily chart, after reaching a 20-year high above 131.20 last week. The pair is moving in a bullish trend on the hourly chart, as it is retesting the resistance level of 130.35 following an initial impulsive rise to the upside. Technical indicators imply that prices will continue towards 133.10.
PIVOT POINT: 130.35
| R1 | R2 | R3 | |
| RESISTANCE | 131.20 | 132.10 | 133.10 |
| S1 | S2 | S3 | |
| SUPPORT | 129.70 | 129.10 | 128.60 |
Spot Gold (XAUUSD)
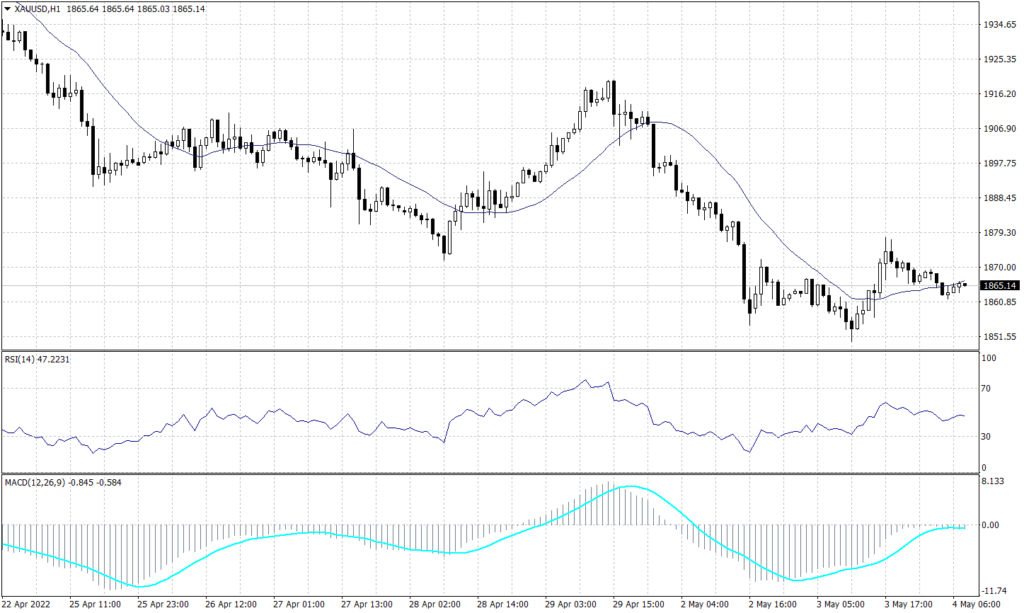
The precious metal is trading under heavy pressure this week and broke below the support range between 1,920 and 1,900. The hedging bullion traded at 1,855 confirming the downtrend towards 1,800 which can be considered as emotional support more than technical support.
The hourly chart shows a continuation of the bearish trend line targeting 1,825 on the hourly chart while targeting 1,800 on the daily chart. Furthermore, both the RSI and the MACD imply that the bearish trend will continue.
PIVOT POINT: 1,860
| R1 | R2 | R3 | |
| RESISTANCE | 1,875 | 1,880 | 1,888 |
| S1 | S2 | S3 | |
| SUPPORT | 1,840 | 1,830 | 1,825 |
WTI (USOUSD)
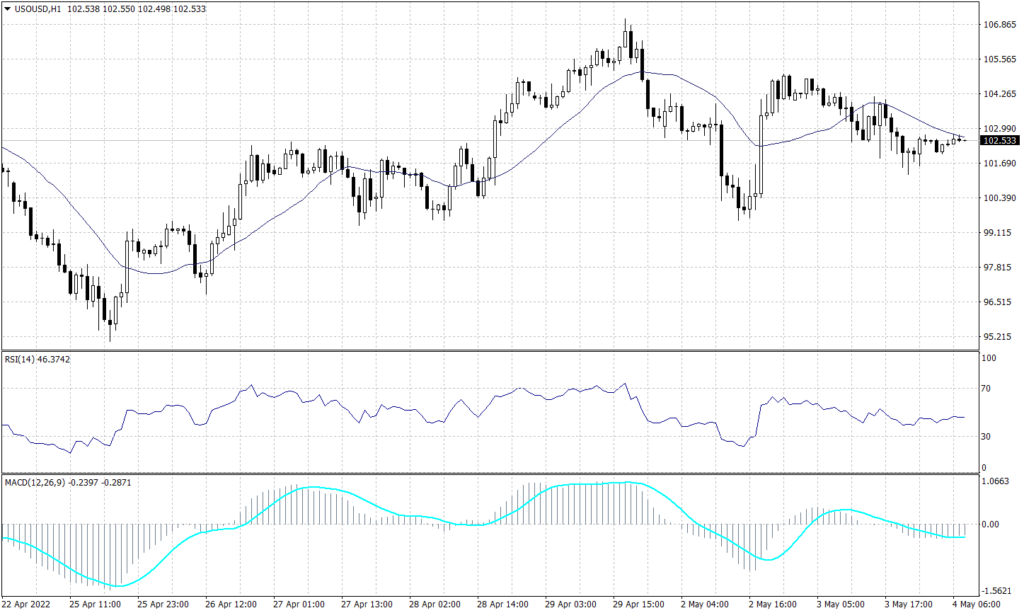
The U.S. Oil traded flat this morning as supply and demand uncertainty takes over the market. Similarly, the overall trend remains undecisive and the short-term short candles favour the negative trend. The crude oil is forming light support at 103 on the hourly chart which is unlikely to hold for long when the FOMC statement is announced.
Technically, MACD and RSI show a high possibility to drop towards $100 a barrel. Meanwhile, the intersection with the 20 periods MA indicates support at the level of $103 a barrel.
PIVOT POINT: 102.50
| R1 | R2 | R3 | |
| RESISTANCE | 102.80 | 103.80 | 104.30 |
| S1 | S2 | S3 | |
| SUPPORT | 101.55 | 100.40 | 99.00 |
Bitcoin (BTCUSD)
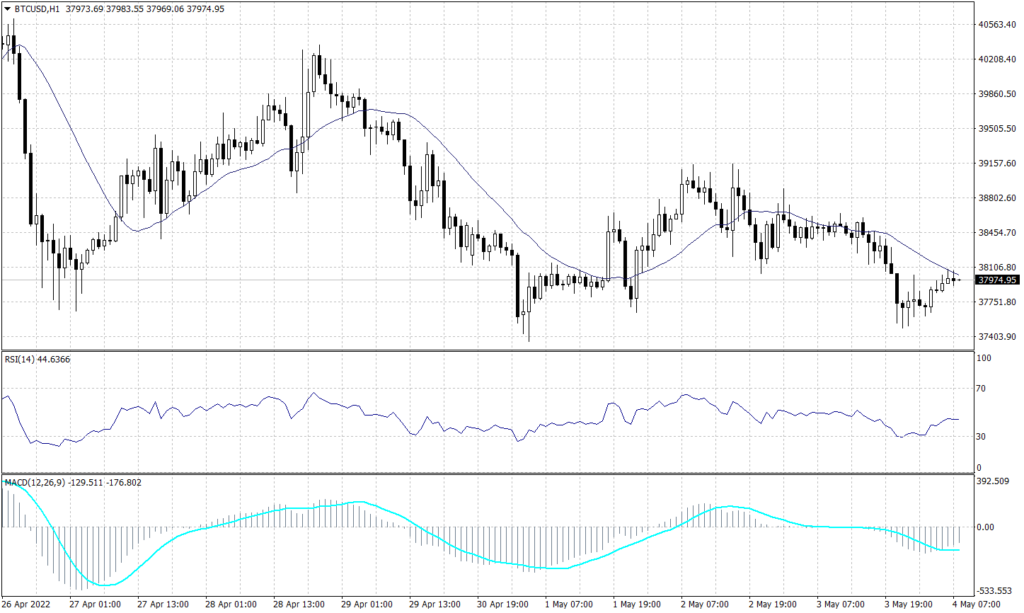
The Bitcoin traded horizontally this morning around the support mentioned yesterday at 38,500. The leading cryptocurrency trend intersects with the 20 period moving average indicating a possibility of a decline towards 37,400.
However, the Bitcoin trend on the daily chart remains bearish and tends to continue unless the price breaks above 41,000, which is unlikely. Furthermore, both the RSI and MACD indicators show a likelihood of further decline towards 37,400 during the day.
PIVOT POINT: 38,000
| R1 | R2 | R3 | |
| RESISTANCE | 38,450 | 39,000 | 39,250 |
| S1 | S2 | S3 | |
| SUPPORT | 37,770 | 37,500 | 37,000 |
