

Fundamentally:
While Shanghai aims to normalize life starting in early June, an increase in new COVID-19 cases in Beijing has raised concerns for further curbs. Meanwhile, Beijing is stepping up quarantine efforts to end its month-old outbreak. In the meantime, market participants await for life normalization in China, which is expected to boost energy demand.
Last week, the Energy Information Administration said that U.S. commercial crude oil inventories decreased by 3.4 million barrels. Likewise, it is expected to see another decline of 2.2 million barrels in the upcoming report tomorrow.
Oil prices fell by around 1% on Tuesday as worries over a possible recession and China’s COVID-19 curbs outweighed an expectation of tight global supply and a pick-up in fuel demand with the U.S. summer driving season. Despite worries about threats to the global economy tight supply limited the downside for prices.
Brent crude futures for July fell 1.2% to $112.08 a barrel. U.S. West Texas Intermediate (WTI) crude futures dropped 1.2% to $109.01 a barrel. Brent gained 0.7% on Monday while WTI settled nearly flat.
Technically:

In the daily chart shown above, the WTI crude prices remain trending upwards in a slower and more cautious fashion. The regression channel considers the current fluctuation as a continuation for the gains on the long run. Meanwhile, the 55 day moving average moves below the current price level showing a possibility of further gains. Additionally, two standard deviations Bollinger Bands are yet far enough from the current prices supporting the upward readings. RSI, is moving in a horizontal line signals a neutral trading behavior, while the MACD signals a positive slope.
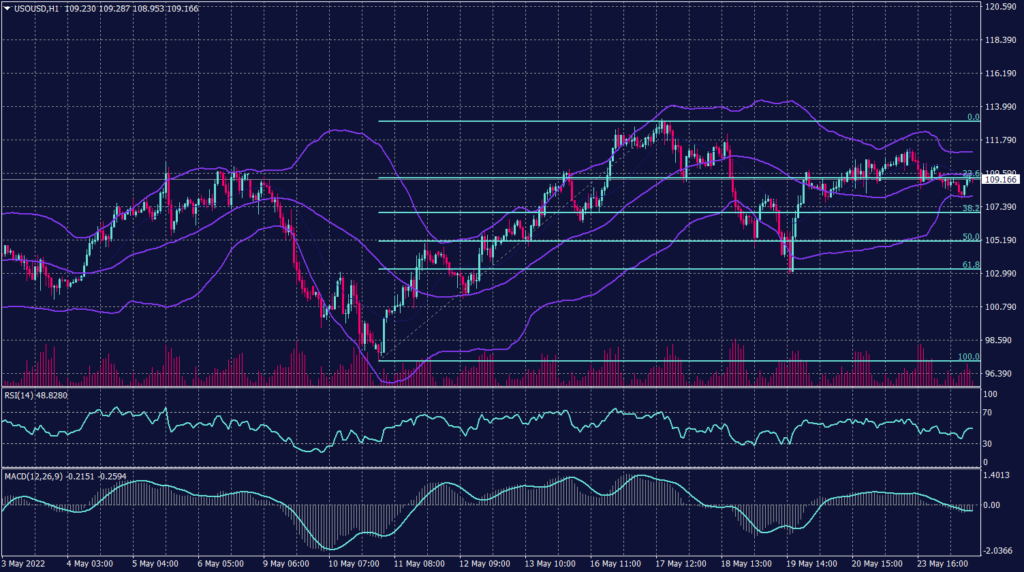
On the hourly chart, the crude shows support at $107.10 and resistance below $111.30. Technical indicators show a possibility to see crude oil lower at $107. However, Fibonacci retracement and 20 periods moving average show a higher probability of continuing climbing.
PIVOT POINT: 109.00
| SUPPORT | RESISTANCE |
| 107.10 | 111.30 |
| 105.75 | 112.75 |
| 104.30 | 115.00 |
