

MARKET NEWS SUMMARY
Sterling Pound (GBPUSD)

From the daily time frame, the overall trend for the Cable is bearish. However, from the hourly time frame, GBPUSD seems to be moving horizontally after an initial break to the downside. The RSI and MACD are within the centre-line which shows that price is likely to keep moving horizontally.
PIVOT POINT: 1.3080
| S1 | S2 | S3 | |
| SUPPORT | 1.3100 | 1.3120 | 1.3160 |
| R1 | R2 | R3 | |
| RESISTANCE | 1.3050 | 1.3030 | 1.3010 |
Spot Gold (XAUUSD)

From the overview of price in the daily time frame, GOLD SPOT price has been moving horizontally after an initial drop from the upside. Likewise, from the hourly time frame, the price is also moving in a horizontal direction as the 20 periods MA is moving alongside the current price levels. The RSI and MACD both signal an indecisive movement of price.
PIVOT POINT: 1,930
| S1 | S2 | S3 | |
| SUPPORT | 1,935 | 1,950 | 1,960 |
| R1 | R2 | R3 | |
| RESISTANCE | 1,920 | 1,915 | 1,910 |
S&P 500 (SPX500)

The general trend of SPX500 from the daily time frame is bullish. From the hourly time frame, the price seems to have broken the previous structure to the upside and is likely to retest around the level of 4,500 and a possible retest of the 20 periods moving average before continuing to the upside. The RSI and MACD both signal price continuation to the upside.
PIVOT POINT: 4,500
| S1 | S2 | S3 | |
| SUPPORT | 4,520 | 4,540 | 4,560 |
| R1 | R2 | R3 | |
| RESISTANCE | 4,460 | 4,440 | 4,420 |
Canadian Dollar (USDCAD)

The daily movement of the price of USDCAD is moving in a horizontal direction. However, from the hourly time frame price seems to be bullish and retesting the level of 1.2575 which has a possible intersection with the 2periodsod MA. The MACD and RSI are above the centre-line which signals a continuation of price to the upside.
PIVOT POINT: 1.2575
| S1 | S2 | S3 | |
| SUPPORT | 1.2620 | 1.2650 | 1.2690 |
| R1 | R2 | R3 | |
| RESISTANCE | 1.2550 | 1.2530 | 1.2504 |
Ethereum (ETHUSD)
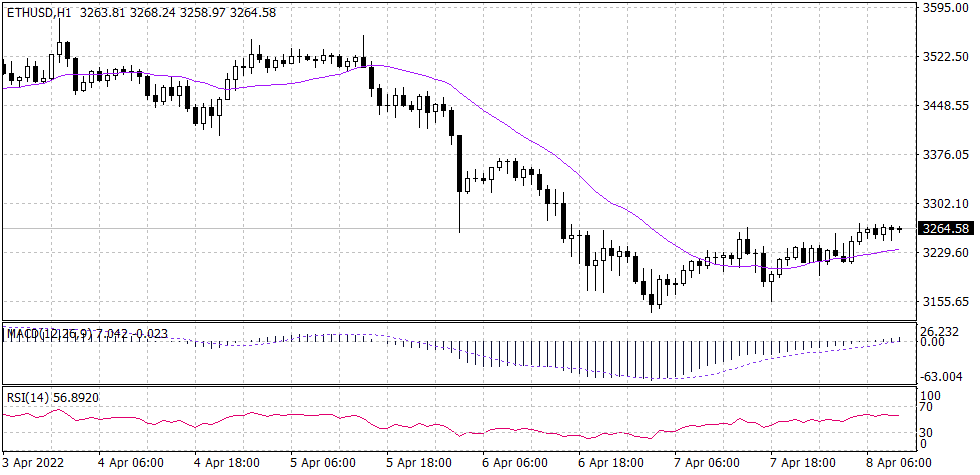
From the overview of the price in ETHUSD, the overall trend from the daily time frame looks bullish. Similarly, from the hourly time frame price has formed an ascending triangle which signals a bullish momentum of price to the upside. The RSI indicates a possible movement of price to the upside.
PIVOT POINT: 3,263.0
| S1 | S2 | S3 | |
| SUPPORT | 3,360 | 3,424 | 3,470 |
| R1 | R2 | R3 | |
| RESISTANCE | 3,210 | 3,160 | 3,115 |
