

Market News Summary
WTI (US OIL)
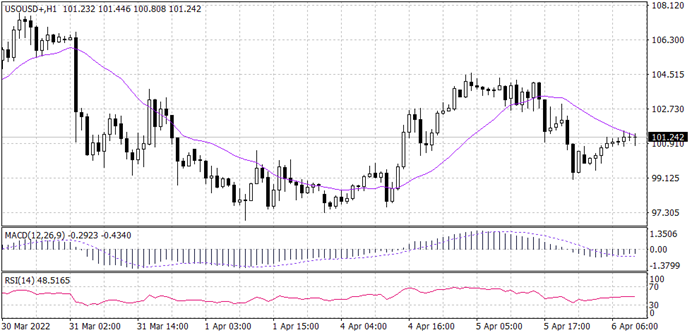
US crude oil (WTI) long-term trend is bearish. However, the price has intersected with the 20 candles MA at $101 a barrel. Fibonacci retracement shows a weak upward movement between the levels of 38.2 and 50, showing strong resistance below $102 a barrel. MACD and RSI show a likelihood of more downward movement towards $99.5 a barrel.
PIVOT POINT: 101.160
| S1 | S2 | S3 | |
| SUPPORT | 99.50 | 98.25 | 97.50 |
| R1 | R2 | R3 | |
| RESISTANCE | 101.50 | 102.00 | 103.20 |
Spot GOLD (XAUUSD)
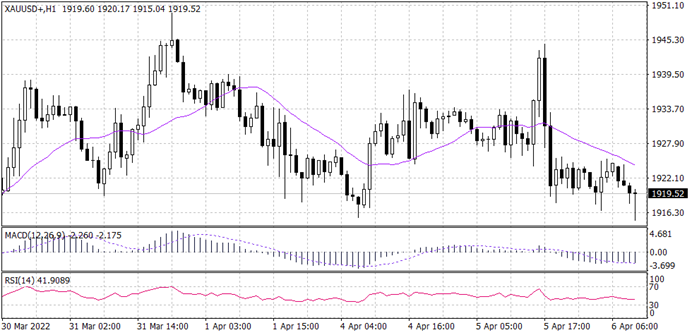
GOLD spot price seems to have changed its trend to bearish after breaking the upward trend line. It has retested the 20 Period moving average resistance level, which has an intersection with the support level of $1,925. Furthermore, the RSI and MACD signal a continuation of the downward trend.
PIVOT POINT: 1,919
| S1 | S2 | S3 | |
| SUPPORT | 1,925 | 1,928 | 1,933 |
| R1 | R2 | R3 | |
| RESISTANCE | 1,917 | 1,914 | 1,895 |
BTCUSD
Bitcoin’s overall trend looks to be bullish as it appears in the long-term chart. Meanwhile, the hourly time frame shows that the BTCUSD price is moving horizontally. Price is making a minor corrective move to the 20 EMA at 45,560. The MACD and RSI both signal a correction trend towards 44,600.
PIVOT POINT: 45,360
| S1 | S2 | S3 | |
| SUPPORT | 45,300 | 44,600 | 44,440 |
| R1 | R2 | R3 | |
| RESISTANCE | 45,430 | 45,600 | 46,000 |
GBPUSD
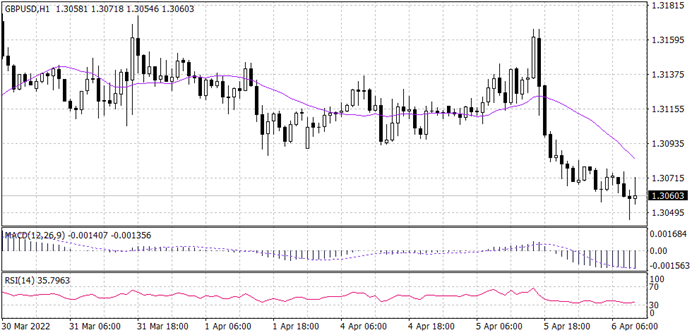
From the overview of price, cable’s overall trend looks bearish. In the hourly time frame price has recently broken the previous low and is likely to make a corrective move to the retest of the 20 candles MA before continuing its bearish direction. The MACD and RSI signaling a continuation towards 1.3050.
PIVOT POINT: 1.3060
| S1 | S2 | S3 | |
| SUPPORT | 1.3048 | 1.3000 | 1.2850 |
| R1 | R2 | R3 | |
| RESISTANCE | 1.3090 | 1.3120 | 1.3150 |
AUDUSD
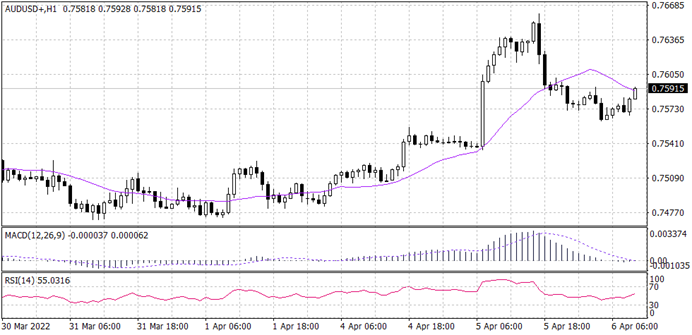
Aussie is showing a bullish trend in the long term against the greenback. however, the hourly time frame price is making minor lows to the downside. Technical indicators show a high possibility of a continuation of the bullish trend. Meanwhile, the 20 candles MA signals a slight correction towards 0.76050.
PIVOT POINT: 0.7590
| S1 | S2 | S3 | |
| SUPPORT | 0.7560 | 0.7540 | 0.7500 |
| R1 | R2 | R3 | |
| RESISTANCE | 0.7605 | 0.7620 | 0.7640 |
