

market news summary
European indices declined at the end of Monday’s trading session, led by healthcare stocks, after finishing the first half with gains of around 8.8%.
At the end of the session, the STOXX600 index declined by about 0.21% to 461 points. The German DAX fell by 0.4% to reach 16,081 points, while the French CAC declined by 0.18% to 7,386 points. The UK’s FTSE ended the session with a decrease of less than 0.1% at 7,527 points.
The slowdown in consumer spending in the United States in May suggests that the Federal Reserve’s efforts to curb inflation through interest rate hikes yield slow results.
Dollar Index (USDX)
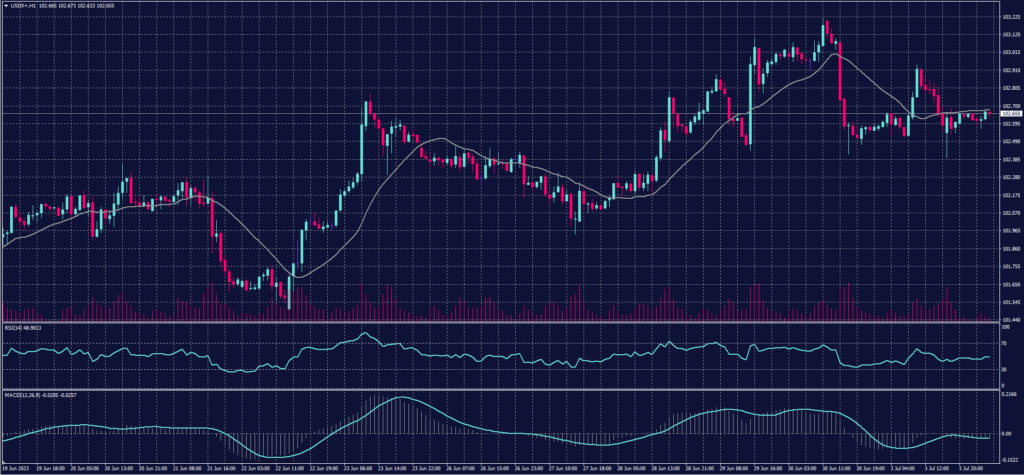
The core Personal Consumption Expenditures (PCE) price index, the Federal Reserve’s preferred measure of inflation, rose by 4.6% on a year-on-year basis after increasing by 4.7% in April.
Investors believe there is an 87% chance of a 25-basis point interest rate hike in July, and they expect rates to remain in the range of 5.25% to 5.5% before declining in 2024.
Pivot point: 102.65
| Resistance level | Support level |
| 102.90 | 102.35 |
| 103.20 | 102.10 |
| 103.45 | 101.80 |
Spot Gold (XAUUSD)
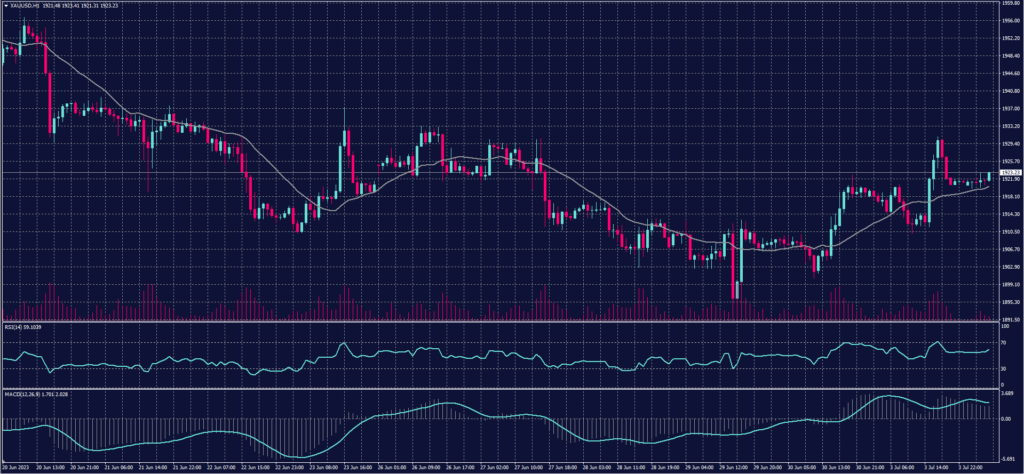
Gold prices rose at the end of Monday’s trading session, reversing their losses recorded during the session itself due to negative data from the United States. The economic data revealed a contraction in the ISM (Institute for Supply Management) manufacturing purchasing managers’ index in the US to 46 points in June, the lowest level since May 2020.
At the close, gold futures rose by approximately 0.7% to $1,930.8 per ounce.
Pivot point: 1920
| Resistance level | Support level |
| 1931 | 1910 |
| 1941 | 1899 |
| 1952 | 1889 |
Dow Jones Index (DJ30ft – US30)
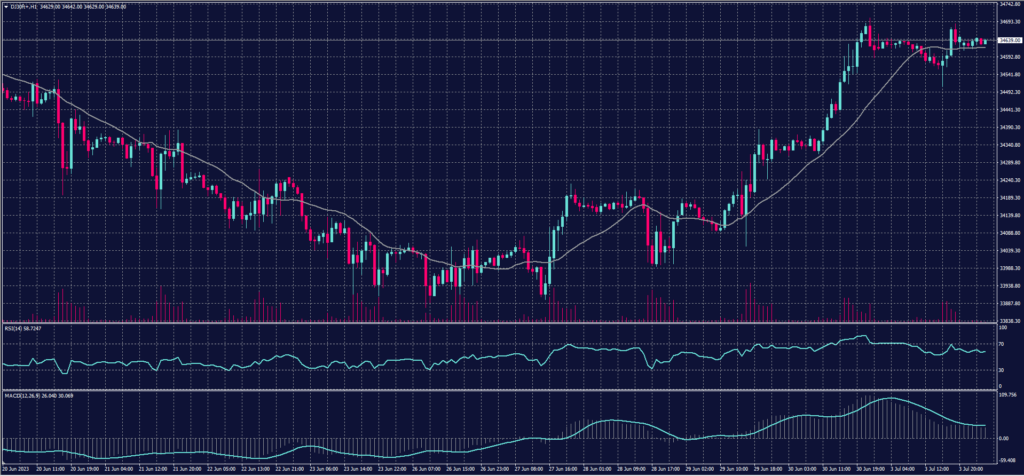
The US indices closed with slight gains in yesterday’s Monday session, as gains in Tesla and banking stocks offset losses in the healthcare sector. Tesla’s stock alone recorded a one-day gain estimated at $57 billion.
The Dow Jones Index saw a slight increase of approximately 0.03%, equivalent to around 11 points, marking its highest close in 7 months.
Pivot point: 34615
| Resistance level | Support level |
| 34720 | 34545 |
| 34795 | 34435 |
| 34900 | 34365 |
US Crude (USOUSD)
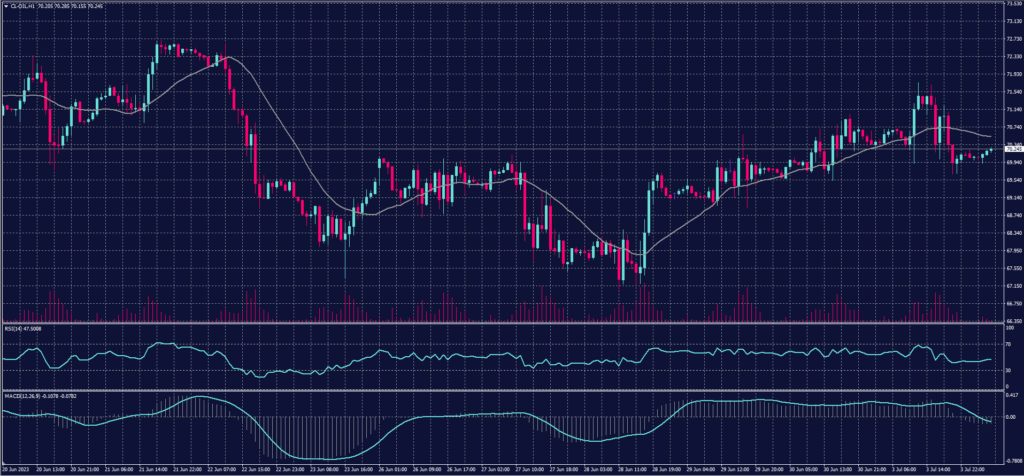
Oil prices declined at the end of Monday’s trading session, despite several OPEC+ countries announcing additional steps to curb supply.
Saudi Arabia revealed an extension of its voluntary production cut of one million barrels per day for an additional month until August. Russia decided to reduce its oil exports by approximately 500,000 barrels per day next month, while Algeria announced an additional voluntary production cut of around 20,000 barrels per day in August.
At the close, Brent crude futures fell by about 1% to $74.65 per barrel, and US crude futures dropped by 1.2% to $69.79 per barrel.
Pivot point: 70.50
| Resistance level | Support level |
| 71.35 | 69.25 |
| 72.55 | 68.45 |
| 73.40 | 67.20 |
Risk Warning
This material provides real-time market analysis from contributing analysts. Please note that any views expressed in this material do not constitute operational advice. It is important to assess your risk tolerance and make independent trading decisions. STARTRADER holds no responsibility for any trading consequences that may arise from relying on the views expressed in this material.
