

market news summary
Deliveries and production of Tesla increased during the second quarter of 2023 on an annual and quarterly basis. Wall Street analysts had predicted that the total deliveries for the company during the three-month period ending on June 30 would reach 445.92 thousand levels.
Janet Yellen, the U.S. Treasury Secretary, believes that the U.S. economy is in a position to maintain a strong labor market while reducing inflation, despite expectations of an economic recession. She added, ‘I still believe there is a path to reducing inflation while maintaining a healthy labor market. Without downplaying the significant risk ahead of us, the evidence we have seen so far suggests that we are on this path.’
On the other hand, PIMCO, the American investment management company, stated that the markets are overly optimistic about the central banks’ ability to avoid a recession while combating inflation in Europe and America. However, PIMCO sees the opposite and prepares for a more severe economic downturn than other investors, as heads of major central banks are preparing to continue their monetary tightening campaign.
Dollar Index (USDX)
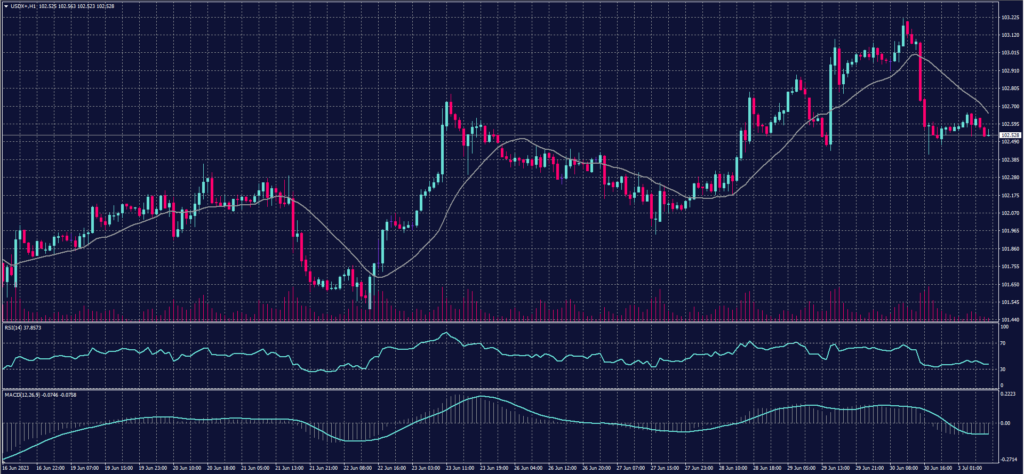
The U.S. dollar index retreated, giving up its gains, following the release of the Personal Consumption Expenditures (PCE) index data, which is the Federal Reserve’s preferred measure of inflation.
The main index dropped to its lowest level since April 2021, recording 3.8%, while the core index, which excludes food and energy prices, reached a level of 4.6%, slightly below the expected 4.7%.
The dollar index did not maintain its levels around 102.75 and declined today to reach levels of 102.35 below its pivot point.
Pivot point: 102.75
| Resistance level | Support level |
| 103.05 | 102.25 |
| 103.55 | 101.95 |
| 103.85 | 101.45 |
Spot Gold (XAUUSD)
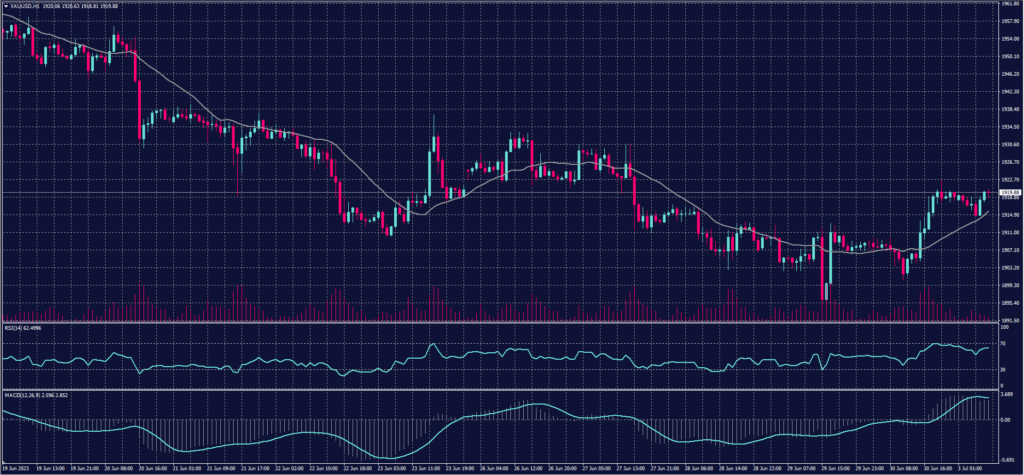
Gold ended Friday’s trading session with gains but failed to achieve weekly, monthly, and quarterly gains due to expectations of further interest rate hikes in the United States. However, indications of declining inflation provided some support for the yellow metal.
Gold rose by 0.6% in the spot market to $1919.57 per ounce but ended the week with a decline of 0.09%.
Pivot point: 1914
| Resistance level | Support level |
| 1927 | 1905 |
| 1936 | 1891 |
| 1949 | 1883 |
Dow Jones Index (DJ30ft – US30)
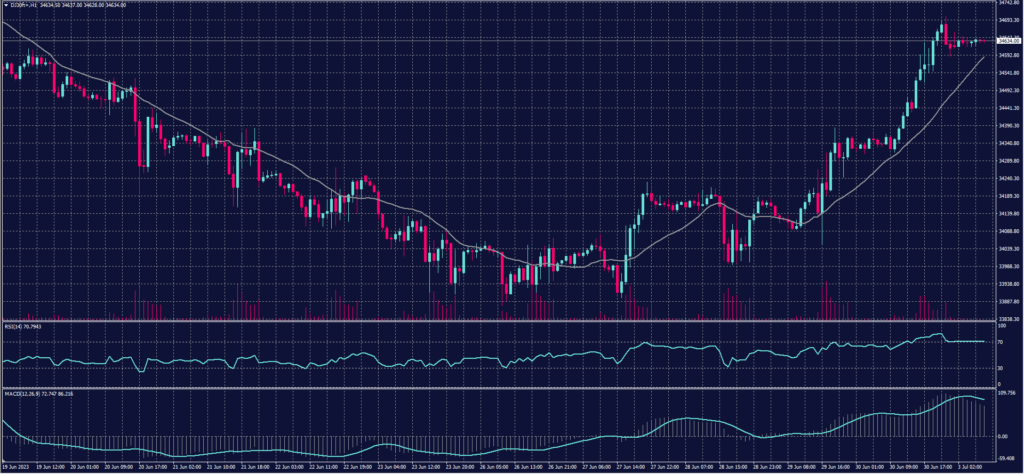
US stock market indices closed higher on Friday, with the Nasdaq, driven by technology stocks, recording its biggest half-year gains in 40 years. This was fueled by inflation data that showed signs of easing, and Apple regained a market capitalization of three trillion dollars.
Based on preliminary data, the S&P 500 index closed up by 53.37 points or 1.21% at 4,449.81 points. The Nasdaq Composite index increased by 193.85 points or 1.43% to 13,785.18 points. The Dow Jones Industrial Average also climbed 278.00 points or 0.81% to 34,400.42 points.
Pivot point: 34540
| Resistance level | Support level |
| 34720 | 34380 |
| 34935 | 34150 |
| 35165 | 33985 |
US Crude (USOUSD)
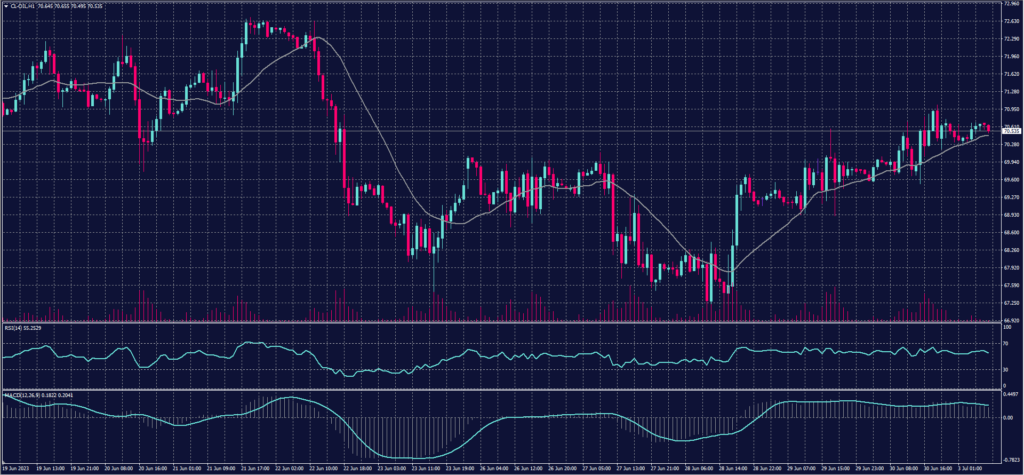
Oil prices declined in early Asian trading today, Monday, as concerns over global economic slowdown and the possibility of the Federal Reserve raising interest rates were met with expectations of supply reductions amidst announced cuts by OPEC+.
Brent crude futures dropped by 20 cents or 0.3% to $75.21 per barrel, after settling with a 0.8% increase on Friday. Meanwhile, West Texas Intermediate (WTI) crude declined by 23 cents or 0.3% to $70.41 per barrel, after closing 1.1% higher in the previous session.
Pivot point: 70.30
| Resistance level | Support level |
| 71.10 | 69.60 |
| 71.80 | 68.80 |
| 72.60 | 68.10 |
Risk Warning
This material provides real-time market analysis from contributing analysts. Please note that any views expressed in this material do not constitute operational advice. It is important to assess your risk tolerance and make independent trading decisions. STARTRADER holds no responsibility for any trading consequences that may arise from relying on the views expressed in this material.
