

market news summary
European stock indices ended Thursday’s session with a decline as ongoing negotiations over the US debt ceiling continued to have a negative impact on the markets. After a volatile day, the Stoxx 600 index ended the session down by about 0.24%. However, technology stocks defied the trend and closed higher by 1.8% following strong results from Nvidia, which provided a significant boost to related stocks.
According to Reuters, citing a source familiar with the talks, US President Joe Biden and Republican Representative Kevin McCarthy came closer to reaching an agreement on Thursday.
Dollar Index (USDX)
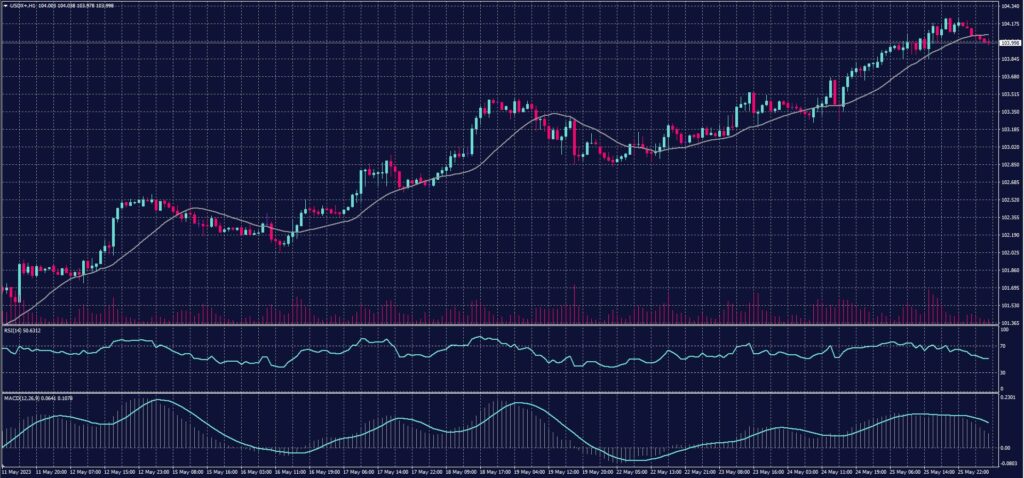
The dollar index rose yesterday, following the release of US unemployment and GDP data, which support the expectation of tightening monetary policy by the Federal Reserve in the near future. The economy showed stronger growth than expected, along with a decrease in unemployment claims, indicating a move away from recession.
The dollar index has now recorded a 0.26% increase to 104.070 points. However, it is also considered a decline from its highest level in two months when it reached 104.23.
Pivot Point: 104.05
| Resistance level | Support level |
| 104.35 | 103.85 |
| 104.50 | 103.60 |
| 104.80 | 103.40 |
Spot Gold (XAUUSD)
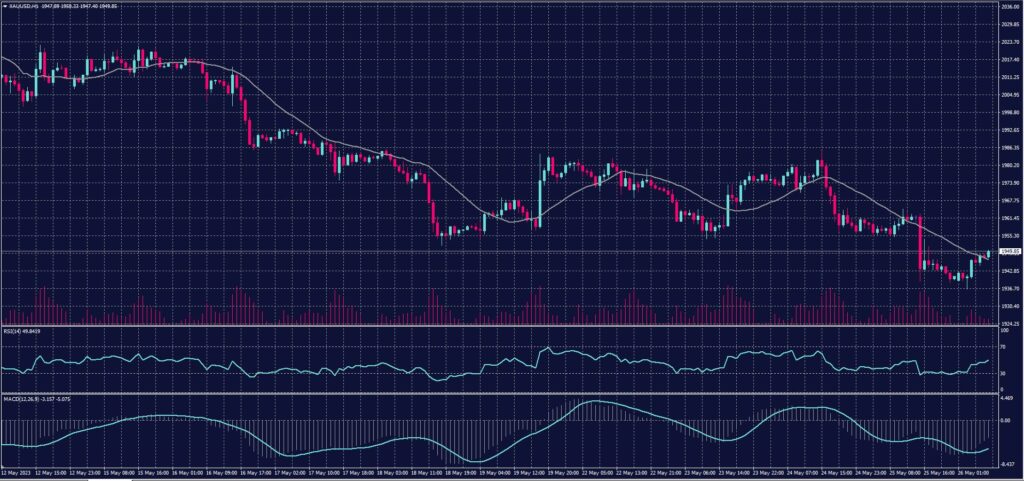
Gold prices rose today, Friday, May 26, with the dollar retreating from its highest level in two months. However, gold is on track for its third consecutive weekly loss as traders assess the progress in US debt ceiling negotiations and await the next monetary policy move by the US Federal Reserve.
Spot gold rose by 0.3% to $1945.39 per ounce after reaching its lowest level since March 22 at $1936.59. Meanwhile, US gold futures increased by 0.1% to $1945.90.
Pivot point: 1948
| Resistance level | Support level |
| 1957 | 1931 |
| 1974 | 1922 |
| 1983 | 1905 |
Dow Jones Index (DJ30ft – US30)
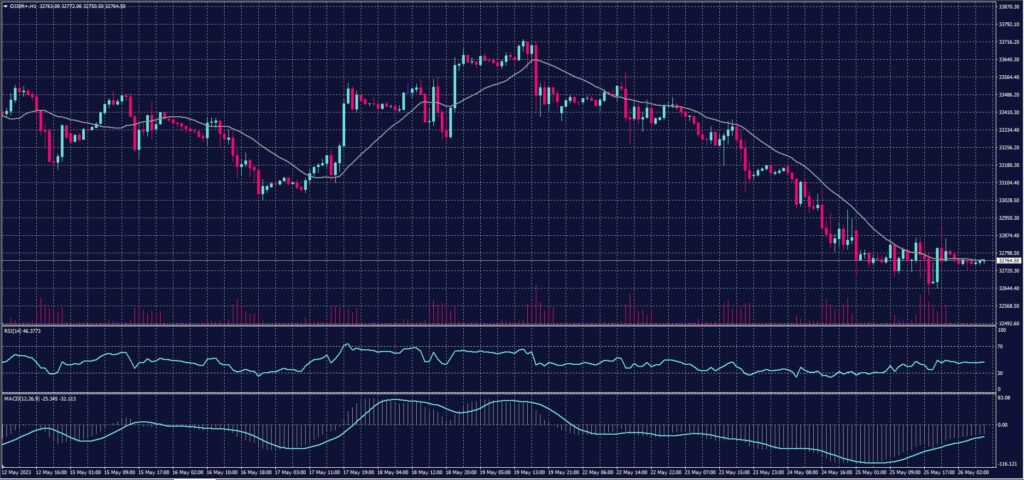
The US indices closed with mixed results in Thursday’s session, amid a recovery in technology stocks and chip manufacturers’ shares following Nvidia’s report. Meanwhile, investors are closely monitoring signs of progress in the US debt ceiling talks.
According to Reuters, citing a source familiar with the discussions, US President Joe Biden and Republican Representative Kevin McCarthy came close to reaching an agreement on Thursday.
The Dow Jones index dropped by about 0.11%, or 35 points, marking its fifth consecutive session of decline and closing at its lowest level in about two months.
Pivot Point: 33,775
| Resistance level | Support level |
| 32930 | 32635 |
| 33065 | 32480 |
| 33225 | 32345 |
US Crude (USOUSD)
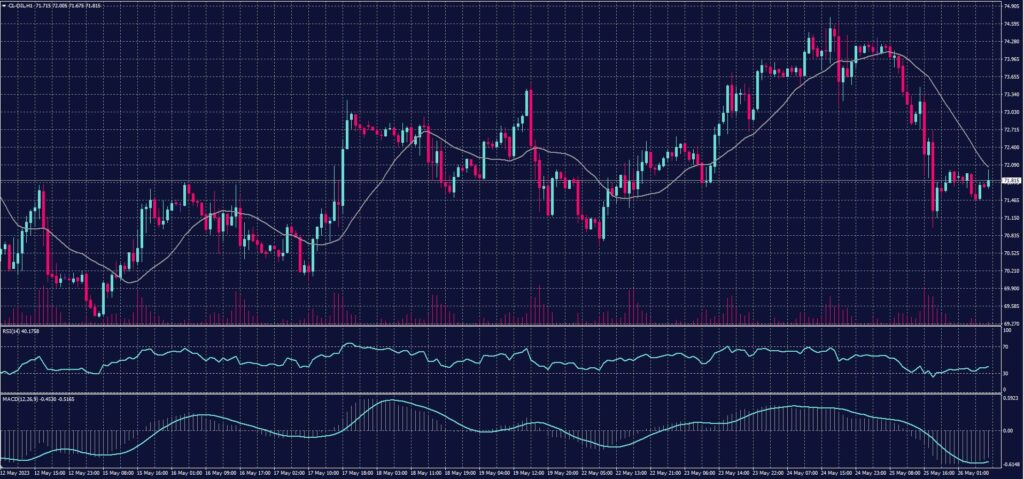
Oil prices declined at the settlement on Thursday after Russian Deputy Prime Minister Alexander Novak downplayed the possibility of OPEC+ announcing further production cuts during its upcoming meeting.
Brent crude futures fell $2.10, or 2.7%, to $76.25 per barrel at the settlement, while West Texas Intermediate (WTI) crude, the U.S. benchmark, dropped $2.51, or 3.4%, to $71.83 per barrel.
Pivot Point: 72.35
| Resistance level | Support level |
| 73.75 | 70.40 |
| 75.70 | 69.00 |
| 77.10 | 67.05 |
Risk Warning
This material provides real-time market analysis from contributing analysts. Please note that any views expressed in this material do not constitute operational advice. It is important to assess your risk tolerance and make independent trading decisions. STARTRADER holds no responsibility for any trading consequences that may arise from relying on the views expressed in this material.
