

Market News Summary
US Treasury Secretary Janet Yellen has warned that failure to raise the debt ceiling would result in a sharp economic contraction in America.
“Our current projections are that we will be unable to pay our bills at the beginning of June unless Congress raises the debt ceiling, which I strongly urge Congress to do,” Yellen said in an interview with ABC. This is the second time in less than a week that Yellen has issued a warning about the possibility of America defaulting on its debts, starting from the beginning of next month.
Meanwhile, China’s foreign exchange reserves have risen more than expected in April due to the decline of the US dollar against major currencies. According to official data released on May 7, China’s foreign exchange reserves increased by about $21 billion to $3.205 trillion last month, surpassing Reuters’ expectations of $3.19 trillion for the dollar.
Dollar index (USDX)
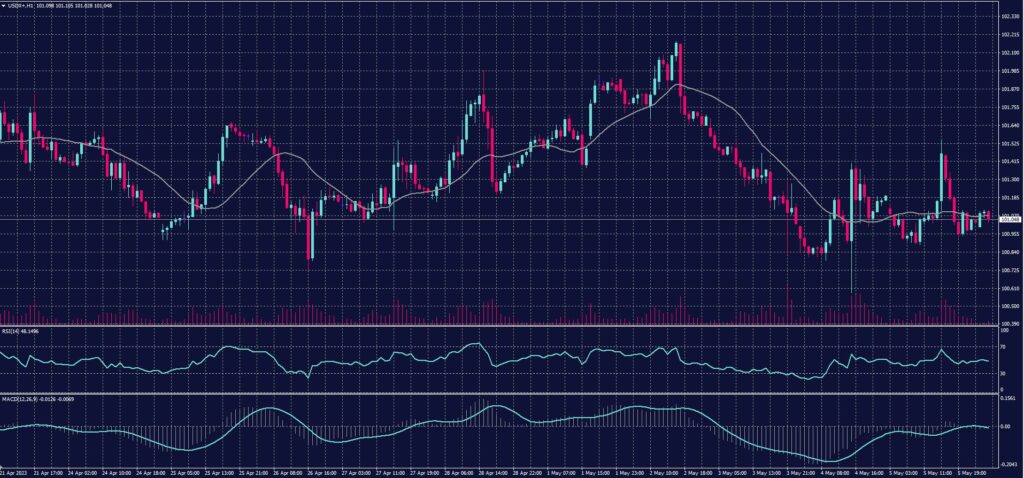
Bank of America has confirmed that the era of the US dollar will not come to an end anytime soon, despite increasing speculation to the contrary. In response to concerns about the impact of a possible default on US debt, the bank stated, “America’s sudden default on its debt could reduce the attractiveness of the dollar as a store of value.” However, Bank of America noted that the main threats to the dollar’s dominant role come largely from local risks, rather than competition from other currencies.
Pivot point: 101.15
| Support level | Resistance level |
| 100.75 | 101.40 |
| 100.50 | 101.80 |
| 99.80 | 102.40 |
Spot Gold (XAUUSD)
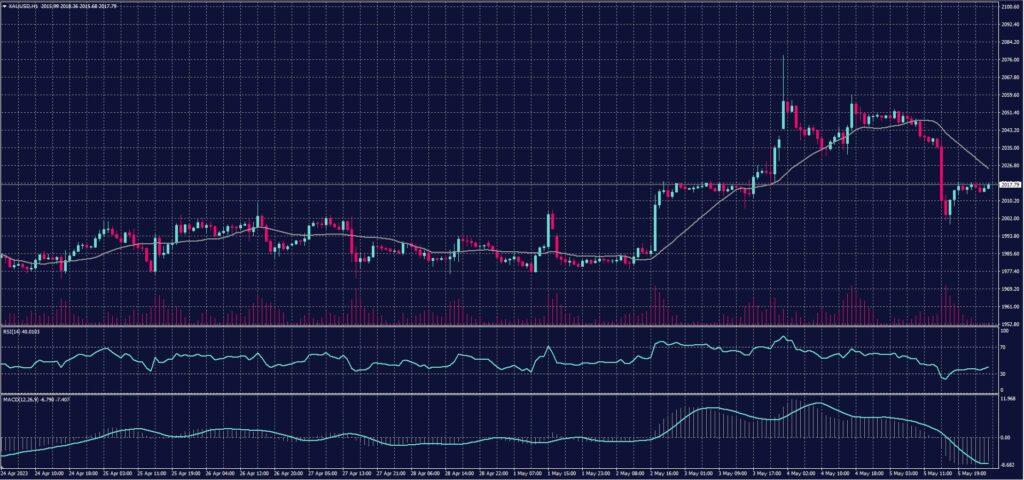
After three consecutive sessions of gains, gold futures fell at the close of trading on Friday, May 5th, due to concerns that the strong US jobs report in April may lead the Federal Reserve to reconsider further interest rate increases.
Gold futures fell by 1.5%, or $30.90, to $2,024.80 an ounce upon settlement, but still recorded a second consecutive weekly gain of 1.3%.
Pivot point: 2022
| Support level | Resistance level |
| 2008 | 2046 |
| 1999 | 2076 |
| 1994 | 2129 |
Dow Jones Index (DJ30ft – US30)
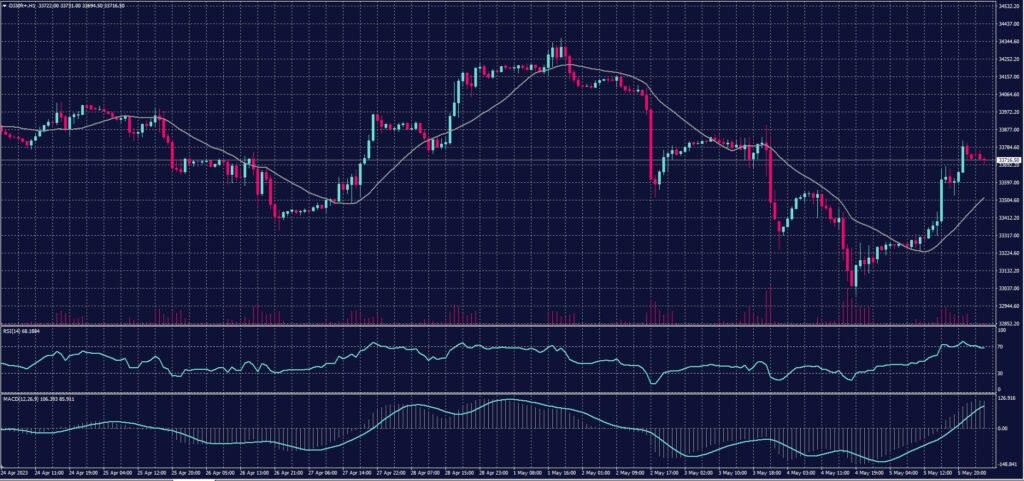
US stocks closed sharply higher on Friday, buoyed by strong results from Apple and positive US jobs data, which indicated the strength of the labor market. Apple’s results also helped calm investor fears about a potential recession.
At the close of trading, the Standard & Poor’s 500 index rose by 1.8%, or 75 points, to 4,136 points, while the Nasdaq index surged by 2.2%, or 269 points, to 12,235 points. The Dow Jones Industrial Average also posted gains, rising by 1.6%, or 546 points, to 33,674 points.
Despite Friday’s rally, the Dow and S&P experienced their worst week since March, with the Dow Jones posting a weekly loss of 1.24%, and the S&P 500 experiencing a loss of 0.8%. The Nasdaq index posted a small weekly gain of 0.07%.
Pivot point: 33570
| Support level | Resistance level |
| 33320 | 33970 |
| 32915 | 34215 |
| 32555 | 34450 |
US Crude (USOUSD)
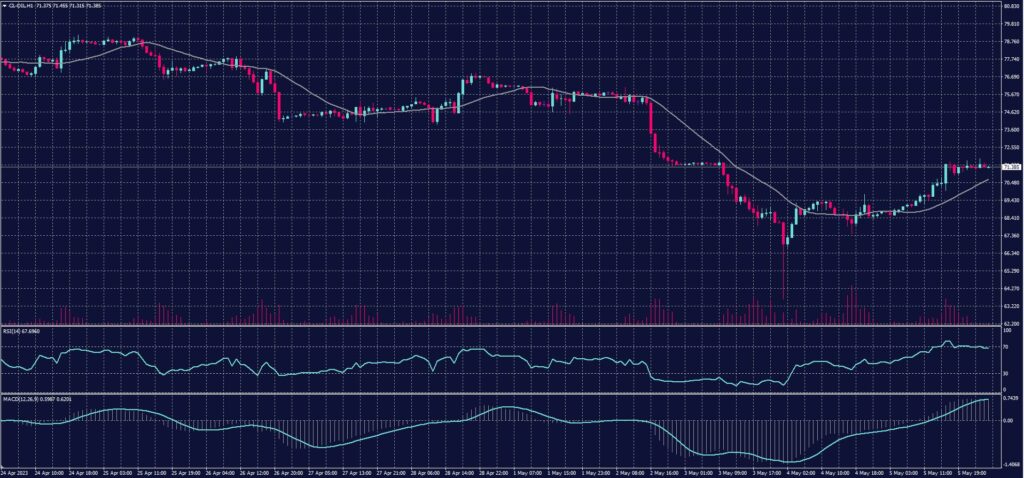
On Friday, oil prices rebounded, but still marked their third straight week of losses. The prices had sharply declined earlier in the week due to the looming decisions by major central banks to raise interest rates and concerns over the banking crisis in the United States, leading to a decline in demand for oil.
Brent crude settled up by $2.80, or 3.9%, at $75.30 a barrel. Meanwhile, US West Texas Intermediate crude increased by $2.78, or 4.1%, to reach $71.34 a barrel at settlement, following a four-day slump that brought it to its lowest level since late 2021.
Pivot point: 70.50
| Support level | Resistance level |
| 69.25 | 72.50 |
| 67.20 | 73.80 |
| 63.80 | 77.10 |
This material provides real-time market analysis from contributing analysts. Please note that any views expressed in this material do not constitute operational advice. It is important to assess your risk tolerance and make independent trading decisions. STARTRADER holds no responsibility for any trading consequences that may arise from relying on the views expressed in this material.
