

market news summary
Investors focus today on consumer price data, which is expected to record 5.1% on an annual basis after it was 6.0% previously. It is also expected to record 0.2% on a monthly basis after it was 0.4% in the last reading.
Investors are awaiting the results of the Federal Reserve Committee meeting to see the Fed’s interest rate plan during the coming period.
European stocks recorded their highest level in a month on Tuesday, supported by the rise of the mining sector ahead of important economic data issued in the coming days, including the US inflation report that investors are awaiting.
The European Stoxx 600 index rose 0.6%, achieving gains for the second day in a row, and the French CAC 40 index closed 0.9% higher after hitting a record level in terms of gains.
Mining stocks jumped 3.6%, achieving their biggest daily percentage gain in more than four months. Automakers rose 1.8%, with UBS Bank rising 1.1% after JP Morgan raised its price target.
Dollar index (USDX)
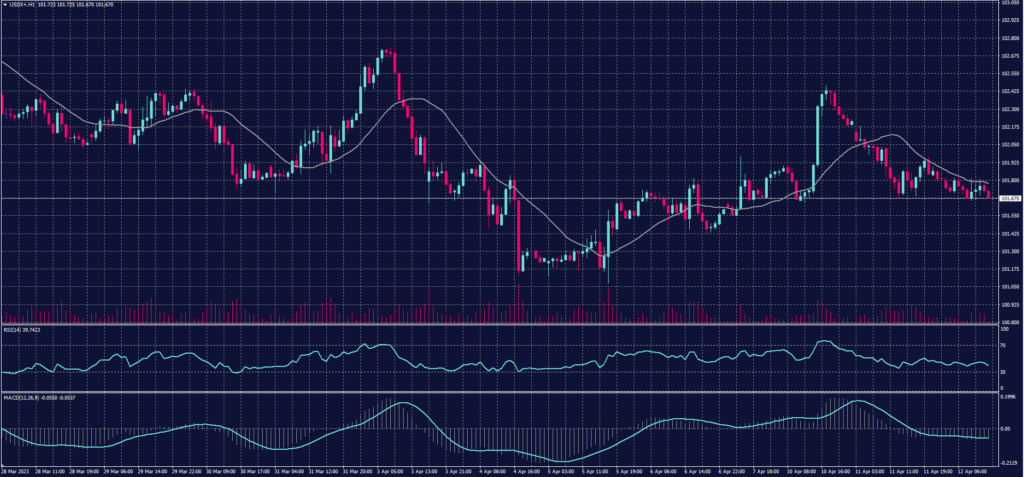
The dollar index fell 0.1%, and analysts estimate a significant decline in the inflation rate to 5.2% in March from 6% in February. Meanwhile, core inflation, which excludes the prices of volatile food and energy prices, is expected to rise to 5.6% from 5.5%.
Pivot Point: 101.90
| Resistance level | Support level |
| 102.10 | 101.60 |
| 102.40 | 101.40 |
| 102.90 | 100.80 |
Spot Gold (XAUUSD)
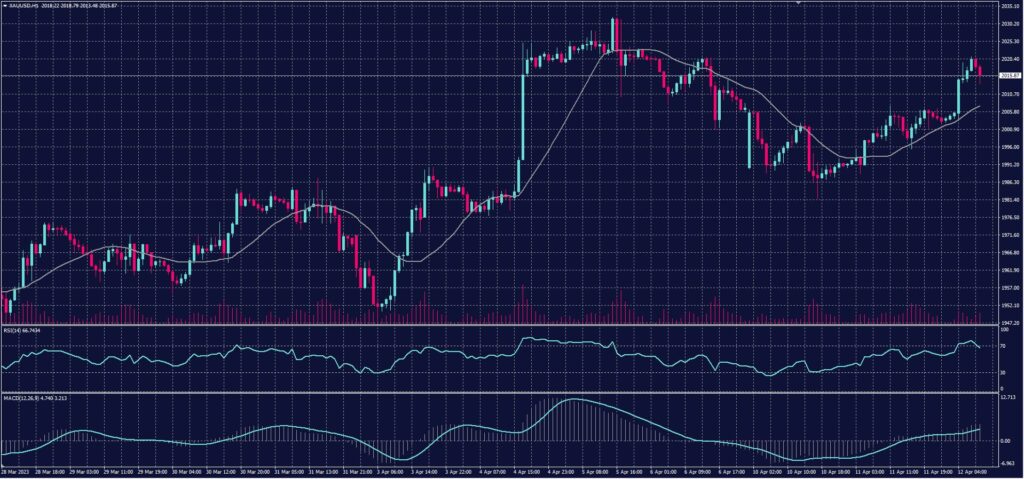
Gold prices rose slightly on Wednesday, April 12th, as the dollar weakened. Moreover, investors focus on important US inflation data due to be released later in the day to find indications of how close interest rates are to a peak.
Gold in the spot market rose 0.1% to $2,005.18 an ounce, while US gold futures rose 0.1%, to $2,020.10.
Pivot Point: 2000
| Resistance level | Support level |
| 2010 | 1992 |
| 2018 | 1,980 |
| 2037 | 1,963 |
Dow Jones Index (DJ30ft – US30)
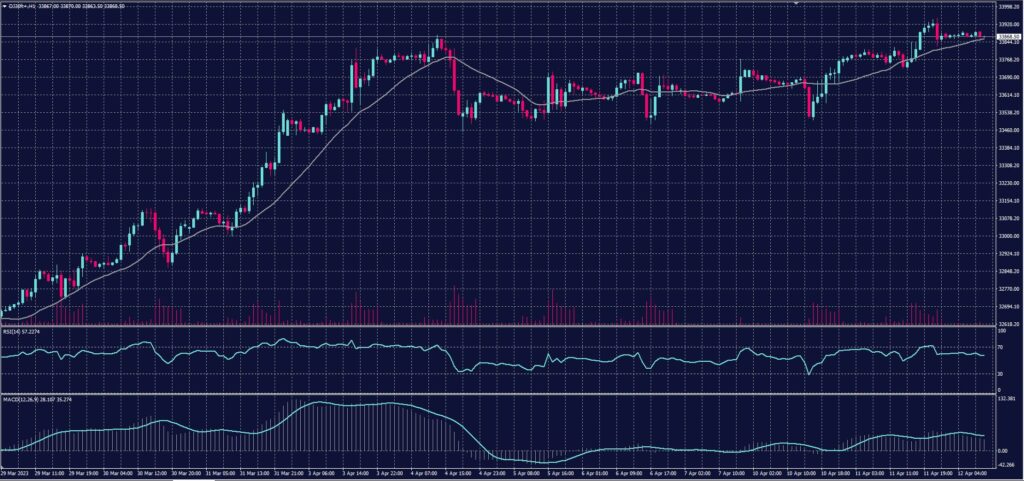
US indices closed on divergence on Tuesday’s session, as investors awaited crucial inflation data and the unofficial start to the first-quarter reporting season.
The Dow Jones index rose 0.3%, or about 98 points, to record its highest closing in 7 weeks, at 33,684 points.
Despite the decline in the technology sector by about 1.2%, the rise in the industrial and basic materials sectors by 1.5% and 0.7% led to the Dow Jones remaining on the rise.
Pivot Point: 33845
| Resistance level | Support level |
| 33969 | 33750 |
| 34070 | 33630 |
| 34290 | 33405 |
US Crude (USOUSD)
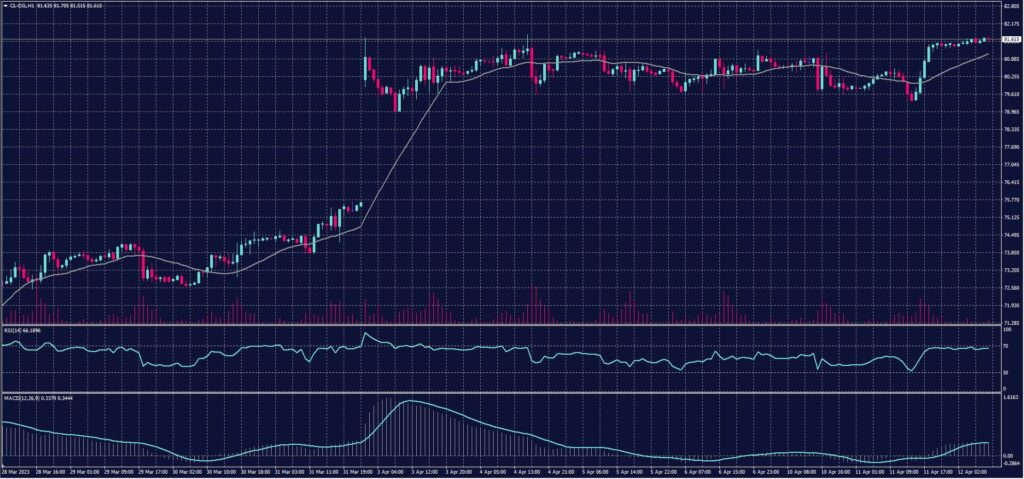
There was little change in oil prices in early trading on Wednesday, April 12th, after data showed an unexpected increase in US crude and gasoline inventories, which compensate for the impact of fears of tight supplies ahead of OPEC production cuts.
Brent crude fell 5 cents to $85.57, while US West Texas Intermediate crude fell 6 cents to $81.48 a barrel.
Pivot Point: 80.80
| Resistance level | Support level |
| 81.80 | 80.00 |
| 82.75 | 78.50 |
| 84.00 | 76.80 |
