

market news summary
European stocks fell on Wednesday as investors were cautious after data indicated a weaker-than-expected recovery for the euro-zone economy.
The European Stoxx index closed 0.2% lower, with the industrial goods and services index declining by 2.1%, limiting the losses by the rise of the utility sector index by 1.6% and the healthcare companies index by 1.7%, with the two indices recording their highest levels since August 2022 with the increasing uncertainty in the economy.
The S&P 500 index fell by 0.2%, declining for the second session in a row, to close below 4,100 points.
Moreover, the S&P 500 was affected mainly by a decline in Nvidia stock by more than 2% after Google said that the supercomputers it uses to train its artificial intelligence models were faster and more energy efficient than similar components in Nvidia.
Dollar index (USDX)
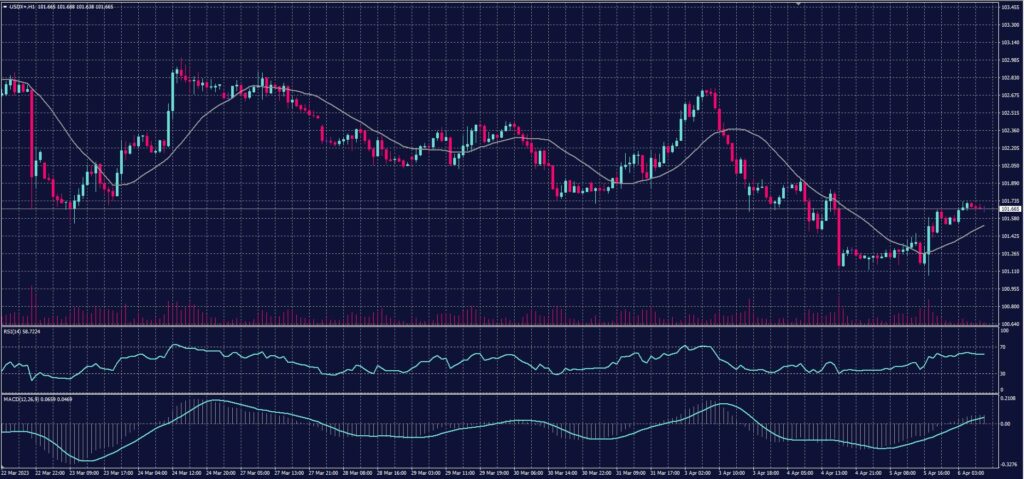
The dollar rose slightly today, but it is not far from its recent low in two months, as traders assess the impact of the non-farm payroll data announced during the weekend on the monetary policy of the US Federal Reserve
Friday’s US nonfarm payrolls report follows disappointing service sector data from the Institute for Supply Management and private sector employment data on Wednesday, as well as a drop-in US manufacturing activity in March at the weekend.
The dollar index rose 0.1% to 101.95 after falling to a two-month low of 101.40 in the previous session.
Pivot Point: 101.40
| Resistance level | Support level |
| 101.80 | 101.20 |
| 102.00 | 100.85 |
| 102.60 | 100.25 |
Spot Gold (XAUUSD)
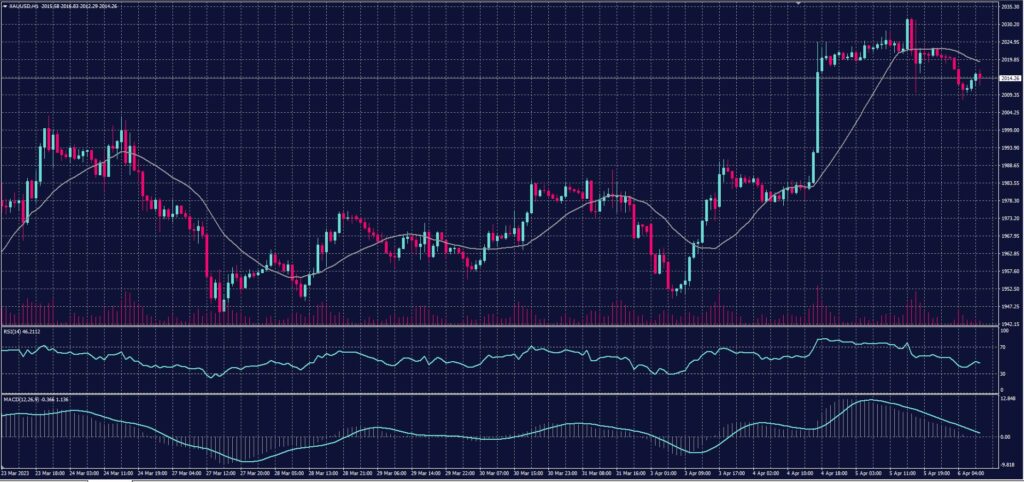
Gold prices recorded their highest levels since March 2022 yesterday, as they continued to rise after weak US economic data reinforced the bet on slowing the pace of raising US interest rates.
Gold in spot transactions rose 0.1% to $2,021.97 an ounce, while US gold futures settled at $2,038.70.
Pivot Point: 2020
| Resistance level | Support level |
| 2030 | 2009 |
| 2042 | 1,998 |
| 2064 | 1,976 |
Dow Jones Index (DJ30ft – US30)
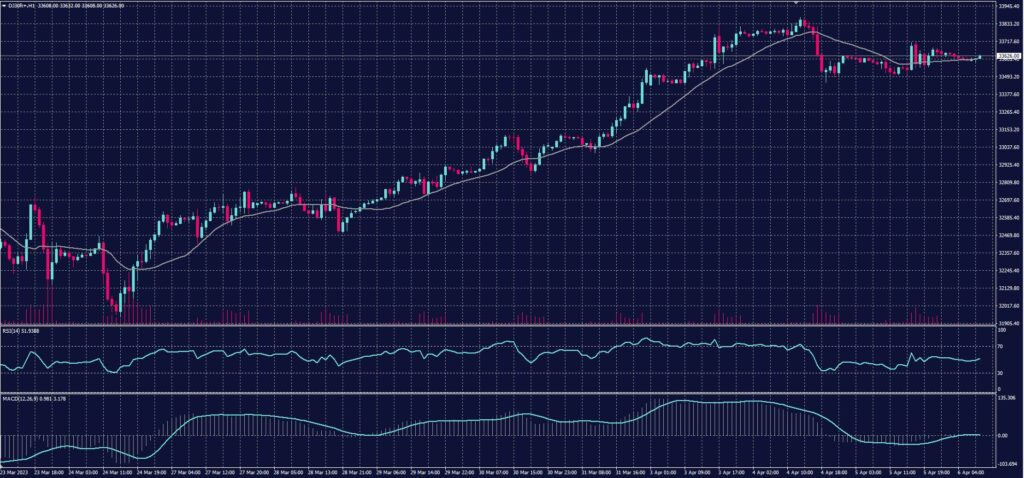
The Dow Jones index rose by 0.2%, or the equivalent of 80 points, to close at 33,482 points.
The support came from Johnson & Johnson shares, which jumped more than 4% to their highest levels in two months. These shares secured the support and approval of thousands of claimants for an $8.9 billion offer to settle lawsuits over the carcinogenic powder, which eased the burden on the company’s plans to list a Kenvue Consumer Health Unit.
Pivot Point: 33620
| Resistance level | Support level |
| 33735 | 33520 |
| 33830 | 33405 |
| 34045 | 33190 |
US Crude (USOUSD)
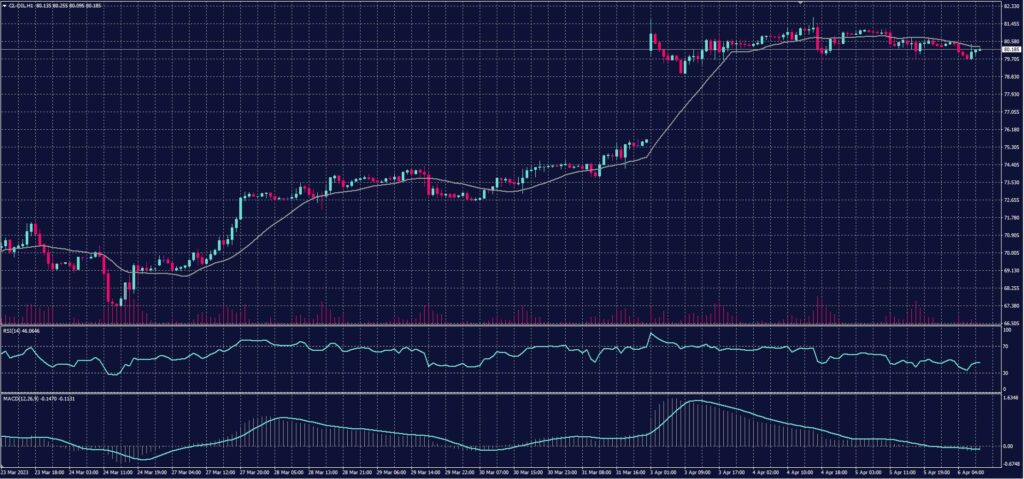
Oil fell Thursday, April 6, as weak US economic data raised fears of a possible global recession and a decline in demand. However, crude prices are heading towards a weekly rise after the OPEC + group announced more production cuts, in addition to a decrease in US oil stocks.
Brent crude futures fell 74 cents, or 0.9%, to $84.25 a barrel, and West Texas Intermediate crude futures fell 73 cents, or 0.9%, to $79.88 a barrel.
Pivot Point: 80.40
| Resistance level | Support level |
| 81.10 | 79.60 |
| 81.90 | 78.90 |
| 83.40 | 77.40 |
