

Markets are trading slowly while investors wait for Federal Reserve’s meeting minutes. Meanwhile, investors will be looking toward the Manufacturing PMI and construction spending.
Later in the week, ADP nonfarm employment and December’s nonfarm payrolls report will also be closely watched. In addition to JOLTS data as well as the minutes of the Fed’s latest policy meeting.
U.S. Dollar Index (USDX)
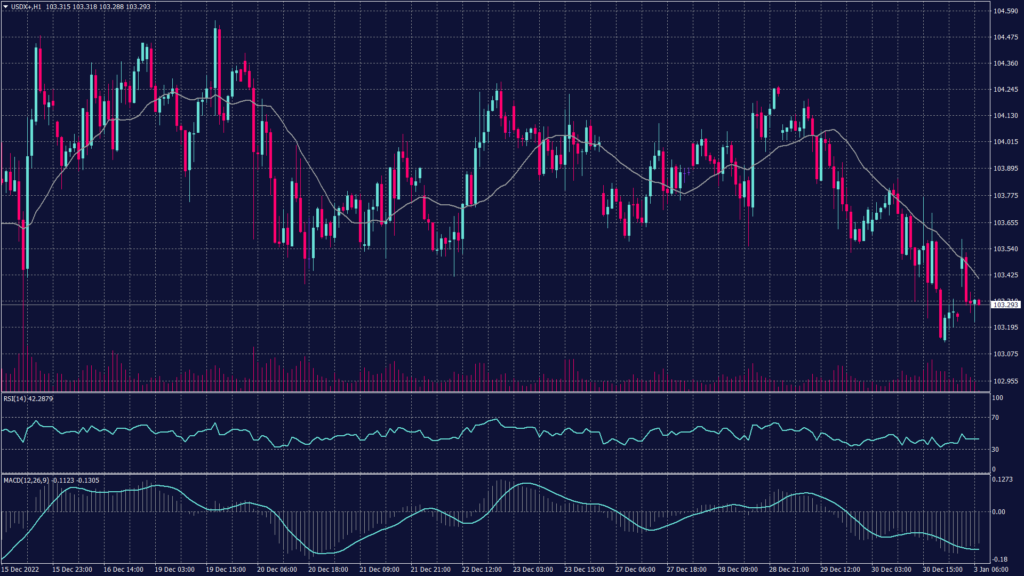
The U.S. dollar traded horizontally during the early trades as investors await Feds meeting minutes. Investors expect the upcoming minutes to provide clues about the expectations of the monetary policy for the new year.
The dollar index has made a quiet start to 2023 and traded up less than 0.1% at 103.710. The index rose 8% last year in its biggest annual jump since 2015 on the back of the Fed raising interest rates to tackle inflation.
Technically, the chart remains committed to the downtrend despite the horizontal fluctuations. 20 periods moving average is still above the current price level and signals further decline. RSI and MACD show decreasing volatility and neutral pressure.
Pivot Point: 103.40
| SUPPORT | RESISTANCE |
| 103.10 | 103.55 |
| 102.95 | 103.70 |
| 102.75 | 103.85 |
Japanese Yen (USDJPY)
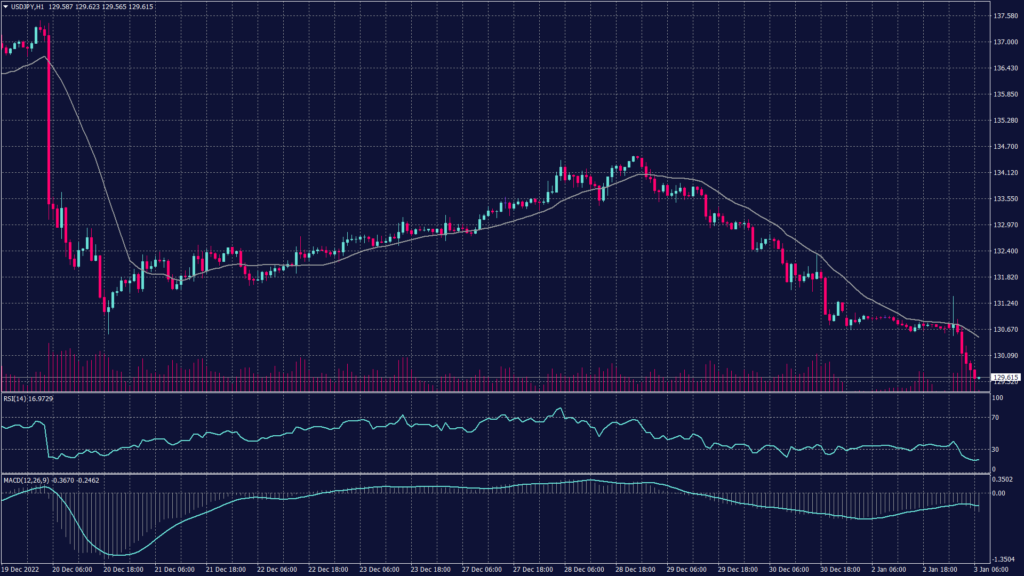
The ninja currency strengthened 0.46% against the greenback to trade below 130, touching its strongest level since June 2022 at 129.60. The Bank of Japan (BOJ) was considering raising its inflation forecasts in January to show price growth close to its 2% target in fiscal 2023 and 2024.
Changes to the BOJ’s inflation forecast would likely fuel further speculation that the central bank is looking to tweak its ultra-loose monetary easing policy and would come after the BOJ shook markets by widening its 10-year yield cap range.
The pair is still in the downward channel to target 128.80 on the hourly chart. technical indicators show signals for further decline and moving averages confirm. The daily chart also confirms the decline after breaking the support level of 131.
Pivot Point: 130.00
| SUPPORT | RESISTANCE |
| 129.50 | 130.55 |
| 129.20 | 131.10 |
| 128.80 | 131.60 |
Spot Gold (XAUUSD)
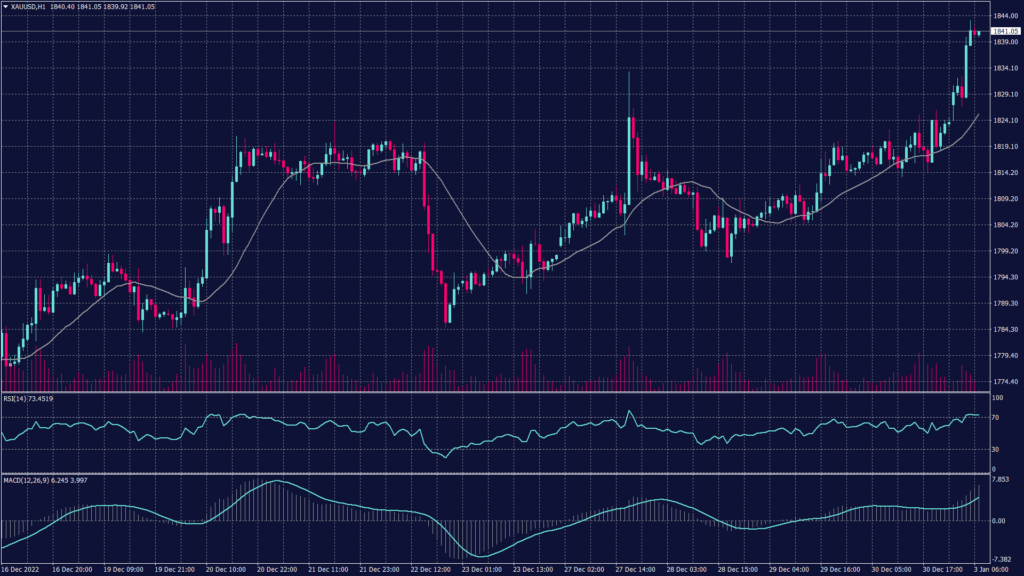
The yellow metal traded close to a six-month high amid a growing number of bets that the Federal Reserve will slow its pace of rate hikes even further. Spot gold prices rose 0.4% above $1,831 an ounce, while futures gained 0.6% to nearly $1,838 an ounce this morning.
Spot gold daily chart shows a continuation of the uptrend while the hourly chart shows fluctuations between 1,835 and 1,841. On the hourly chart, RSI shows overbuying and signals a possibility of a decline to relieve the buying pressure, meanwhile, the MACD intersects with the moving average and signals a divergence and a slight decline.
Pivot Point: 1,840
| SUPPORT | RESISTANCE |
| 1,835 | 1,850 |
| 1,830 | 1,855 |
| 1,825 | 1,860 |
WTI Futures (CL-OIL)
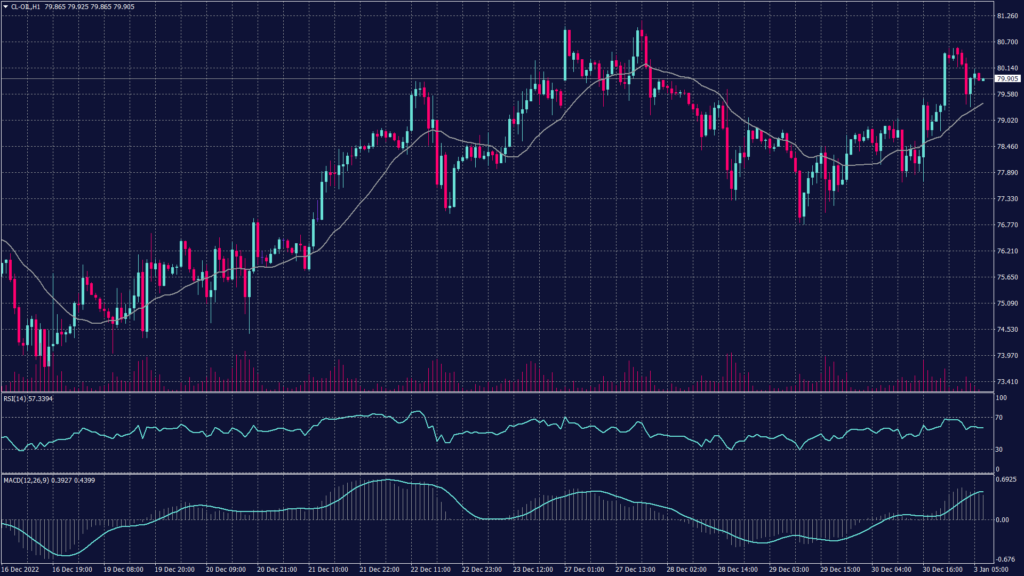
Crude oil prices fell this morning and started the year in a slow fashion. The warning on economic growth from the International Monetary Fund (IMF) and increased concerns over China’s COVID-19 crisis brewed uncertainty over strength in demand.
Brent oil futures fell 0.8% to $85.34 a barrel, while West Texas Intermediate crude futures fell 0.7% to $79.72 a barrel.
WTI hourly chart shows a continuation of the uptrend and awaits confirmation above 80.60. Meanwhile, RSI and MACD show fluctuations and a slight decline to ease the buying pressure.
Pivot Point: 80.40
| SUPPORT | RESISTANCE |
| 79.70 | 81.10 |
| 79.50 | 82.20 |
| 79.10 | 83.50 |
